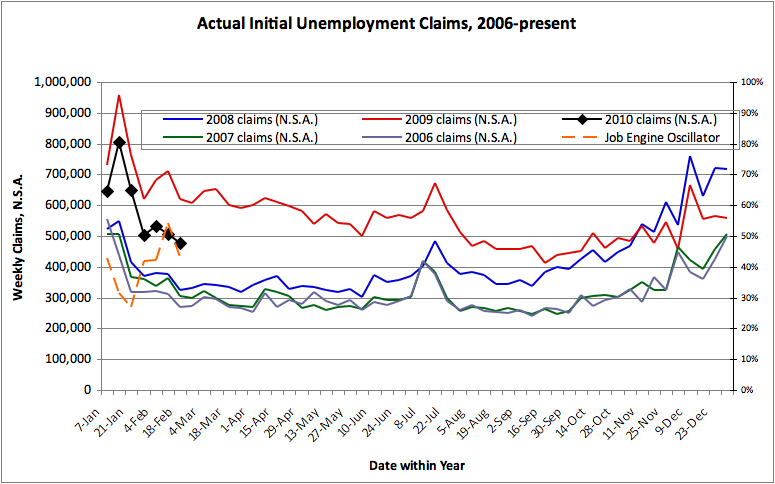
Update Feb. 18: similar chart as last week, but the new “Job Engine Oscillator” has been added… This ranges from 0 to 100%, with 100% being a strong economy – claims at a minimum (for a given week) within the data on the chart, and 0% being a terrible economy – claims at a maximum (for a given week)… This week’s data shows a drop in the Oscillator and a weakening of claims. Making matters worse, one wonders whether the claims last week may have been impacted by the East Coast blizzard.
The weekly unemployment claims data is looking a bit better than in early January, but it still sits midway between the “healthy economy” levels and last year’s “panic” levels. This doesn’t feel like a recovery. I will try getting the equivalent data from the 2000-2005 period for comparison..