DOLETA reports 414,657 actual unemployment claims for the week ending April 3, and puts that at 460,000 seasonally adjusted, an increase of 18,000 from the prior week. The media spin on this is negative. BUT… As shown below, this is actually a very favorable weekly claims report. Last week the claims number was 41% of the way up from the low values of 2006-2007 to the high value of 2009 *for this week*; this week it is only 31% of the way up. The claims data continue to trend towards the “healthy” market level.
I do not know where the Department of Labor gets its seasonal adjustment factors from, but the fact is that there was a surge in claims during this time of year (an increase of about 30,000, generally this exact week, sometimes 1 week earlier) in each of the past 4 years. Their seasonal adjustment factor doesn’t seem to be filtering that out correctly.
Related Links and The Chart:
Department of Labor Weekly Unemployment Claims for Week Ending April 3
Calculated Risk
Hoocoodanode (Calculated Risk Comment Thread)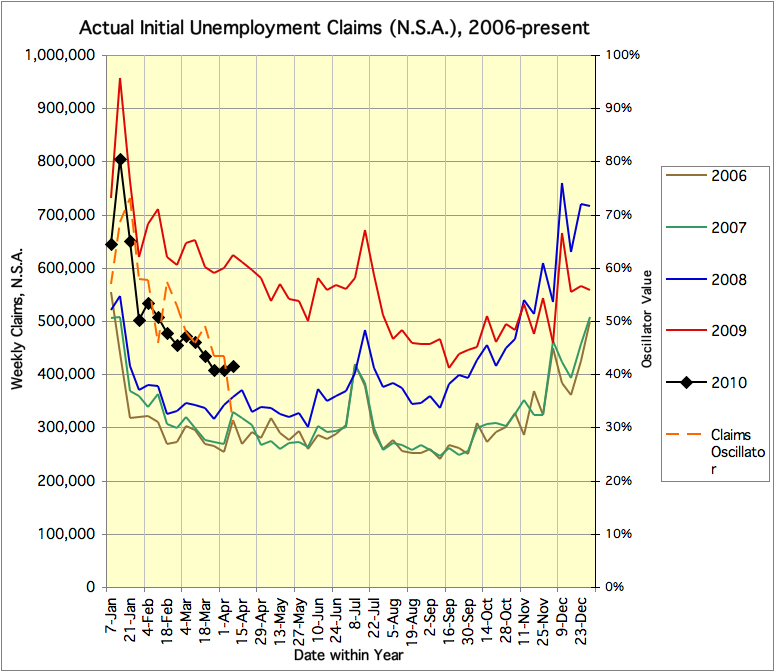
Per a Bloomberg article , a “Labor Department analyst” (don’t these people have names?) reportedly said something to the effect that (don’t these people get direct quotes?): “Easter is a particularly difficult to adjust for seasonal factors because its a floating holiday that doesnt come at the same time each year, the government analyst said. Additionally, a state holiday in California on March 31 also complicated the tabulation of the data, he said.”
I think the chart above is pretty clear and doesn’t need much media obfuscation!