A recent post by Calculated Risk reminded me to comment that the Federal Reserve’s “EMRATIO” metric is worse than it looks (and it looks bad already). EMRATIO is frequently misreported as being “the employment to population ratio”. Sometimes the writer aims to be less inaccurate and says it’s the “fraction of adults who are employed”. EMRATIO is really meant to measure how much of the potential labor force is currently working, and typically runs around 0.6, meaning 60% of the “adult population” is “employed”. EMRATIO has recently been declining as a result of job losses during the recession, which is bad enough. But there is a demographic issue in play as well, because of the aging population, and EMRATIO doesn’t capture this very well. In EMRATIO, the “population” not only excludes children, it also excludes “institutionalized” adults (who still need to be fed … and many of whom could be productive). EMRATIO doesn’t include the military – it’s just “civilian” employment. And EMRATIO also appears to include working teens in the employment number, but not in the “adult population” number. So EMRATIO is really an approximate “civilian employment to adult workforce ratio”. Which is fine, but not if everyone thinks it’s the actual employed workforce divided by the total population… because that number is substantially lower! The employed workforce has to feed not only the unemployed adults but also the children, the military and the “institutionalized” adults (including criminals and more).
So EMRATIO is useful, but misleading. I think what really matters is the “Mouths To Feed Ratio”, that is the number of “mouths to be fed” divided by the “number of workers” – and there’s a way to generate that using the Federal Reserve’s FRED graphs database:
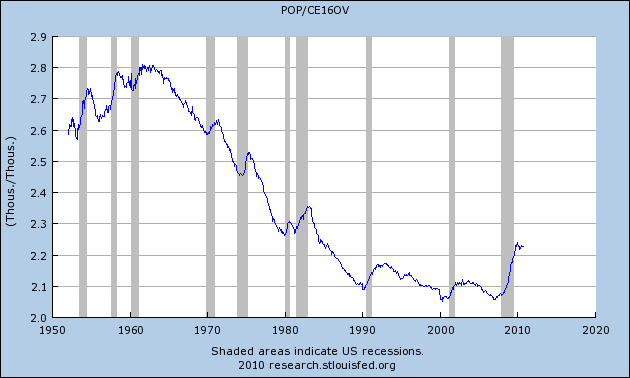
What this shows is that during the Baby Boom years of the 50’s and 60’s, when there were a lot of single-worker households and a lot of children, there were 2.6 to 2.8 people per worker. From the early 60s until 2000 or so, that number trended down. Each worker had fewer and fewer mouths to feed, as demographics became more and more favorable. But that situation has reversed. The 2003-2008 boom failed to bring in enough workers to bring the MTF ratio back down, and the Great Recession’s job losses, together with older workers retiring, have sent the MTF ratio back up to levels last seen in the early 1980s.
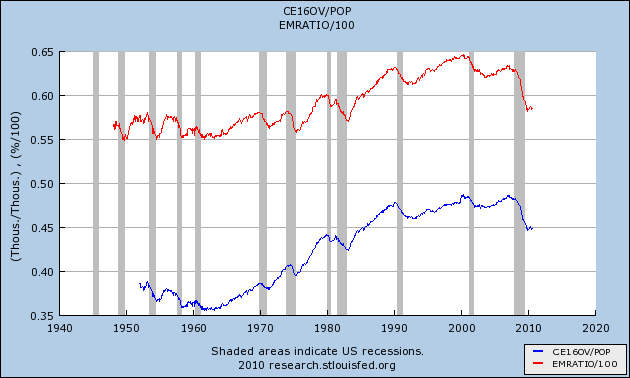
In fact, if we invert the MTF ratio, we can compare it directly to EMRATIO, and we see that the MTF ratio is about 13% lower than EMRATIO. I am surprised that this ratio isn’t smaller still, since there should be enough children to take it down 20-25%. But clearly less than half of the nation is currently employed:
Finally, the last plot below shows the two components of the MTF ratio (but beware the suppressed zero in the graph). Both have trended upwards and basically doubled in the past 60 years, but in the last decade the population growth has outstripped the employment growth.
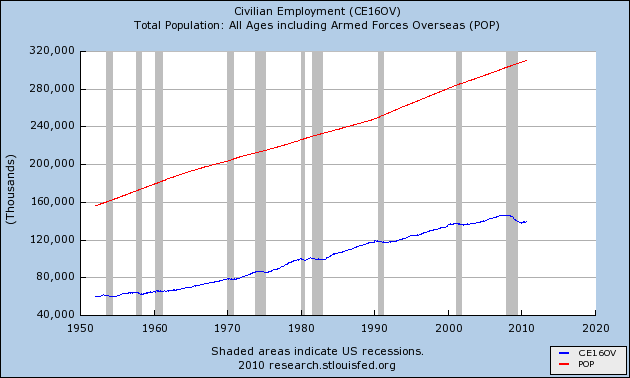
If population growth continues to exceed employment growth, there will be ever more Mouths To Feed per worker. This in turn puts pressure on workers to lower their savings rates and defer retirement, or to lower their personal standards of living in order to support household dependents. It also creates pressure on both workers and employers to pay more in taxes, to maintain benefits for an increasing number of non-workers, via Social Security, Medicare, education and so on. This will be a major challenge for public policy, and it also has major implications on the sustainability of economic growth and the current high level of corporate profits relative to GDP.
Footnote: My data is from the FRED site; I would appreciate clarifications if anyone who reads this has some good links.
I absolutely agree with what you have written here.
I posted something similar last month as part of a pension fund hell post. I plotted nonfarm payrolls as a percent of population.
http://illusionofprosperity.blogspot.com/2010/09/pension-fund-hell.html
“The chart above shows total nonfarm payrolls divided by the population. Note the growth from 1960 to 2000. Those days are over. Welcome to pension fund hell.”
As dire as your analysis is, there is one more thing to ponder that is equally dire.
In my opinion, more mouths to feed per worker could lead to fewer households. Very few would be expecting that. Here’s what I posted back in January.
http://illusionofprosperity.blogspot.com/2010/01/long-term-household-formation-trends.html
“There’s a risk that the long-term trend is forming a bottom. There’s an additional risk that it won’t just bottom, but that it will actually begin to reverse. The stock market’s been stagnant for a decade. Unemployment is now extremely high.
The population will most likely continue to grow, but if more and more people live together in the same household (“for economic reasons” as seen above) then that’s just one more headwind for the housing market.”
Here’s another thing to think about.
http://www.electwomen.com/?p=3123
“For the first time in recorded history, women outnumber men on the nations payrolls.”
It is my belief that our economy grew faster than it normally would because women entered the workforce (and therefore the workforce was able to grow faster than the population overall). That long-term trend has reached its natural conclusion. There’s little to no more growth left to extract from it.
Glad to see “great minds thinking alike”, as the saying goes. I entirely agree about the risk of reduced household formation and larger household sizes. If there are more mouths to feed per worker, more people are economically dependent on individual workers, and at the micro level it’s far more cost-effective for dependents to live in one household, than in multiple places. Along those lines, I wonder if the Japanese experience might provide some valuable data.
If-when the Federal Government is forced to bring outlays in-line with revenues, Social Security and Medicare are necessarily going to be squeezed (in real terms at least), and the elders will face economic pressures to merge households in order to cut costs and preserve living standards. Alternatively, workers will face higher tax rates, and again face pressures to cut living expenses.
I’ve also noticed your point that the trend of women entering the workforce has reached its endpoint … unless we stop having children altogether, there’s no more workforce growth from that source. If-when the economy recovers, the choices for workforce growth apparently boil down to older workers, younger workers, or immigrant workers. (Or, if grandma and grandpa move in with their kids, the kids might work longer hours in exchange for grandma and grandpa doing the household chores and helping with the kids?) Right now the data are showing that the older workers are eating the younger workers’ lunch, in terms of unemployment rates.
I also should have linked to my earlier post on this subject:
http://blog.i4sg.com/2010/01/09/labor-force-participation-rate-decline-expected-and-bad-news/
Back in January I pointed out that the workforce demographics would necessarily lead to both harsher recessions and weaker recoveries – and that policymakers should have anticipated this years ago! If we as a nation didn’t have our collective head in the sand (or a worse place!), we could have spent the last decade having a decent, public discussion of what to do about it, working up reasonable policy options, and figuring out politically tolerable solutions. Instead we get crisis after crisis and “hoocoodanode” reaction from policymakers. Shame on us!