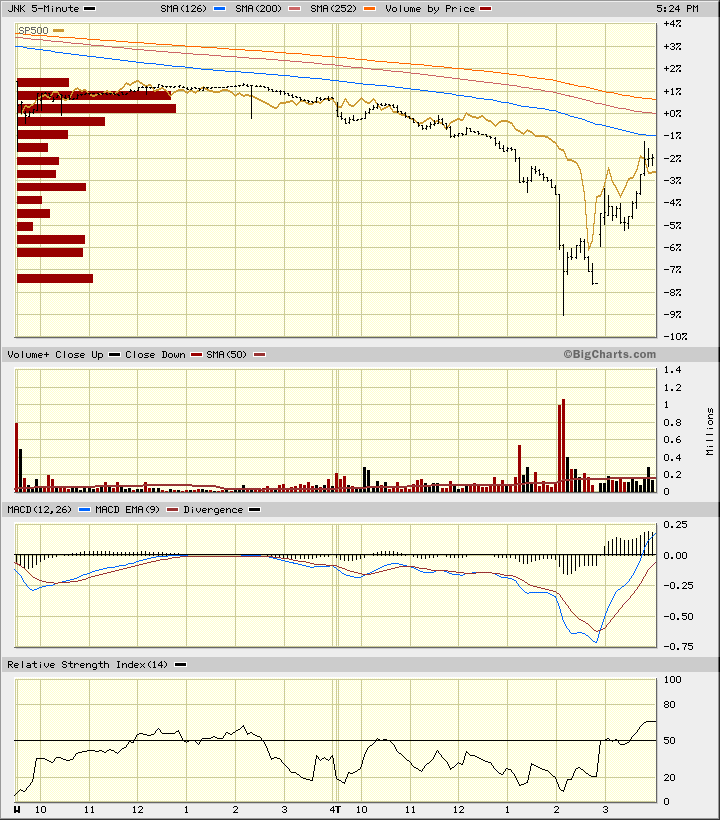
Both JNK and HYG cratered about an hour ahead of the SP500.
Also, the only thing preventing today from getting a “Hindenburg Omen” warning is that there were not enough new highs. But a significant number of stocks (200+ in bothy NYSE and NASDAQ) hit new 52-week lows, suggesting a soft underbelly in the markets.
The imploding charts where stops were run and no underlying bids were found bodes ill for trading in the near future. I worry that the sheer amount of tradeable information released in the panic today is going to lead to a lot of aggressive moves tomorrow. Learn how to trade options from top-rated trading professionals with the options trading course offered.
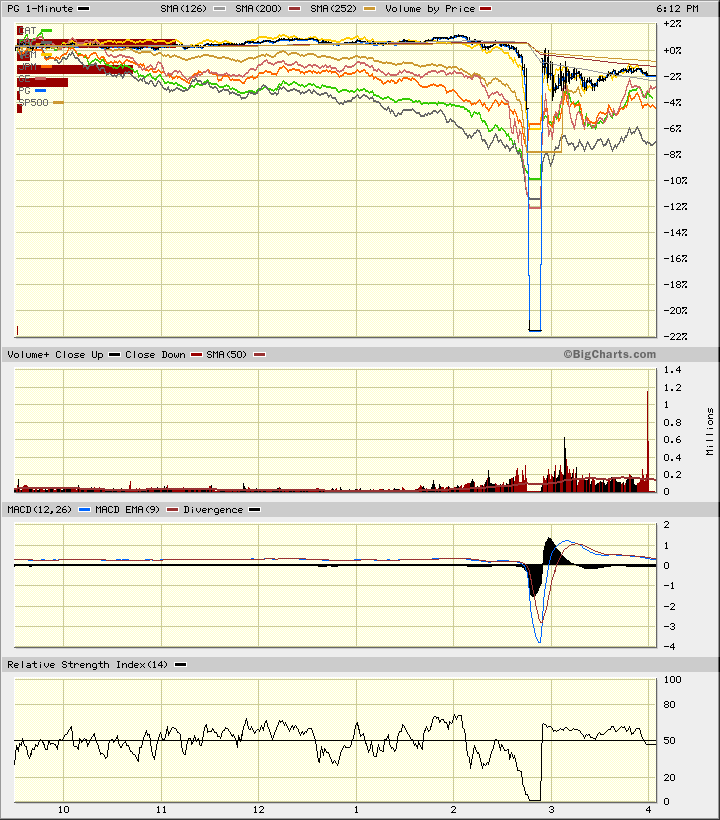
Here’s what some of the DOW components (including the alleged P&G “fat finger”) did. Note that they were all in deep doo-doo before the market cracked and fell apart. There may have been one particular trade that broke through the bids on P&G (which got hit worst of the group in the chart), but this was a systemic issue and not a single idiot at a terminal.


Nice charts, nice comments; does seem very unusual and “systemic” — so what does that mean, going forward?
I think this means we’re in a bear market again. Down days like that simply don’t happen in bull markets. Until strong, de-leveraged hands control the issues once more, events like yesterdays are likely to repeat.
I am sitting mostly in cash now and looking for a capitulation day followed by a follow-through day. Yesterday may or may not qualify as capitulation.
Found you via Econbrowser comment. Great observation – hadn’t heard of this before. What about PHB? Also, wondering if the underlying junk bonds also started to crash around 2:00.