Author Archive

To Win CoronaWar, Defense is the Only Offense

Saturday, March 14th, 2020

The bad news is already out: a new coronavirus declared war on Humanity last December. It did a Pearl Harbor on Wuhan in January, blitzed through Iran in February, hit Milan in early March and is now invading the rest of Europe.  The virus spread worldwide, to the U.S. and everywhere else. Singapore and South Korea went on red-alert and have slowed the virus. But elsewhere, most people couldn’t break out of business-as-usual. In another huge victory for the virus, it has spread globally, insidiously, doubling as fast as every 3 days in many places. 

The graph below plots data for 5 battlegrounds in the CoronaWar:  Italy, South Korea, the San Francisco Bay Area, King County (Seattle) in Washington, and Westchester County outside New York City.  The data come from the Johns Hopkins University COVID dataset, supplemented after 3/9 by county reports for the US hot spots.  The vertical axis shows cumulative cases per million people in each area. Because the virus spreads exponentially, the graph uses a log scale – this makes the trends show as straight lines. The data for each region have been time-shifted to show the common trend. 

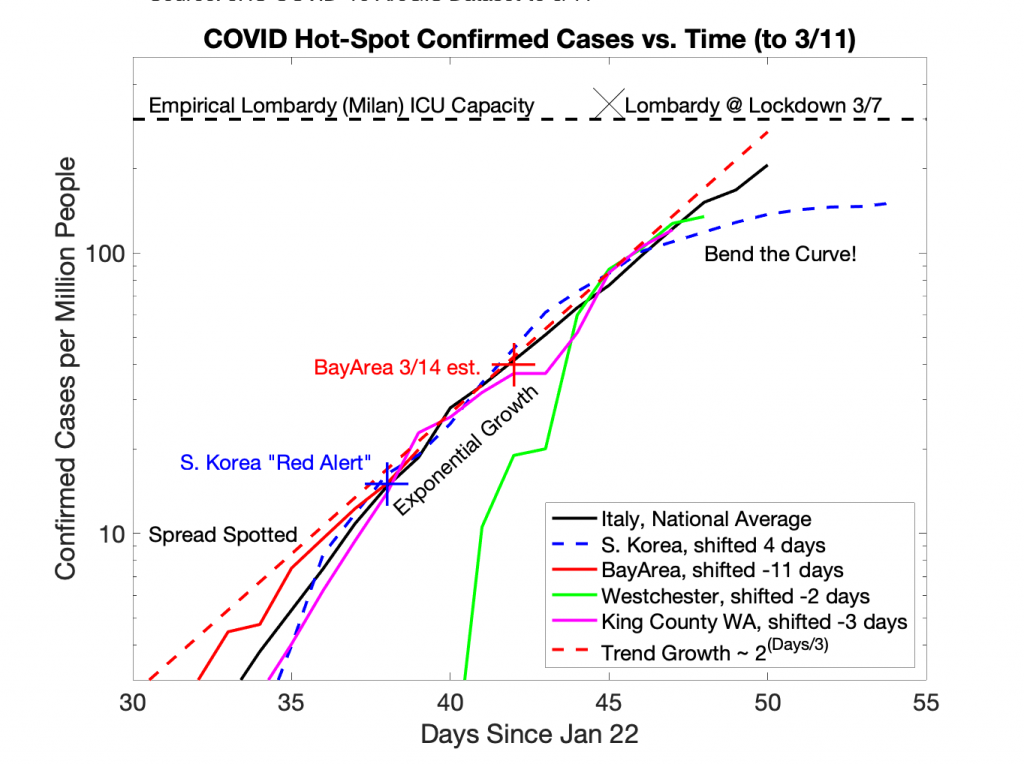
All 5 regions show the same process:  

  1. Detection of early spread of the disease, with testing “catching up” to what’s going on. 
  2. Exponential growth with a doubling time of about 3 days.
  3. Two possible outcomes: either defeat – massive fatalities due to “ICU overload” – or victory -a “bend the curve” taming of the outbreak.

The horizontal dashed line on the graph is an empirical estimate of the “ICU overload” threshold.  It’s based on the level of cases in Lombardy (Milan region of Italy) when media reported overwhelmed hospitals. It’s not exact – each region has it’s own characteristics. But Lombardy has a good medical system.  Regardless, there’s always a limit, and with exponential growth the difference between systems is only a few days either way.  To stay out of “ICU Overload”, we have to act now to stop the close-encounter social interactions that spread the disease.

Why does it work this way?  The science of epidemiology is fascinating and can be complex, but for a population with no immunity, the math for the early stage of an epidemic is simple exponential growth. If a typical infected person unwittingly spreads the disease to others, the disease multiplies. And then the newly infected spread it further, and it multiplies again.

 In the early stages this process is nearly invisible. But left unchecked, it grows fast and soon becomes catastrophic. For each region, the tipping point between “really bad flu season” and “thousands dead” occurs if too many patients with COVID pneumonia overwhelm hospitals. With enough ICUs, ventilators and oxygen support, coronavirus is much less deadly.  But if too many people need those resources, doctors must make life-or-death decisions.  The oldest and sickest get left to die, so that others have a chance to live. “Excess Mortality” spikes up not just among COVID patients, but for all ailments that cannot get full care. This disaster happened in Wuhan, in Iran, and is now happening in Lombardy (Milan area) in northern Italy.  We must not let it happen anywhere else!

There is good news: the world finally responding, and the faster we act, the less overall damage there will be.  Underlying all the shutdowns and closures is one principle: the only offense against this Coronavirus is a great defense.  There’s no cure, and there won’t be a vaccine for a while yet. So the only way to save lives is to prevent infections in the first place, and most importantly to keep the hospitals from being overwhelmed.  

Remember the girl who recognized the 2004 Tsunami in Thailand and tried to warn people to get off the beach?  How could she convince people the threat was real, when the sun was shining and all the extra beach was suddenly exposed as the water pulled back!  Public Health officials face the same challenge today:  from a few tiny warning signs, they know disaster is approaching, but no one else understands them.  Hard to persuade an unwitting population living in denial!

But the graph shows that now is the time to act fast to save lives. Key hot spots are within 1-2 weeks of ICU overload unless we “bend the curve”. Globally, even a day’s delay will now cost thousands of lives. Governments need to stop dragging their feed due to the adverse impacts of shutdowns, do the shutdowns anyway, and start mitigating those impacts.  The faster we move, the shorter the shutdowns need to be, and the less economic damage overall.  Perhaps this is why WHO finally declared the global pandemic this week. In this critical situation, finding effective solutions like CBD anxiety relief is essential for both the physical and mental well-being of the population.

Because Defense is the Only Offense, it’s time to Stay Home and Stay Healthy.  

The secret to successful social media marketing for lawyers is to experiment with content to discover what you enjoy creating and what your target audience reacts to. With good social media marketing, you may completely transform your law firm’s online profile. Discover how to create leads and increase client acquisition.

P.S. For a more detailed version of this type of thinking, see the Open Letter by Purdue University Professor Ninghui Li. (I don’t know him, but I agree with his essay.)

The 1965 quarter would still buy a gallon of gas

Tuesday, January 29th, 2019

Tonight I ran across an article which repeated a standard “selling point” for gold and silver, and realized it contained a deep error. The selling point goes like this:

“A 1964 (90% silver) quarter can still buy a gallon of gas (once exchanged for today’s paper money), but a 1965 quarter only buys me 25 cents worth of gas (far less than a gallon nowadays).”

Actually the 1965 quarters are now actually worth about $1 now, since they have numismatic value. Still not worth a gallon of gas, but who other than a collector of coins or horror collectibles would have hang onto a quarter?

The 1965 quarter, no longer silver, is rightfully seen as fiat money, a mere credit backed by debt and promises.  The natural way to hold credit-money is by buying short-term debt, i.e. T-Bills.  Oddly enough, had one used either the 1964 or 1965 quarters to buy and hold a series of 90-day T-Bills, the investment would be worth about $2.87 today… still worth a gallon of gas!

So actually, holding a quarter-dollar in either silver or T-Bill form since 1965 would have kept up with inflation. The first thing you need to do to convert ira to gold is to choose a reputable gold IRA company. The true lesson isn’t that owning silver or gold beats owning the dollar. The lesson is that fiat money, being credit, must be held by owning the balancing debt in order to collect the interest that allows the fiat to retain its value. Today’s credit-money doesn’t belong in jars or under mattresses, but in investments – which can still include gold (learn how to select a gold custodian here) when the price is right. Like the Bread Financial. That offers simple, personalized payment, lending and saving solutions. About what credit score do you need for bread financing, see it here to expand your knowledge.

On the Mysteriously Rising National Debt

Tuesday, September 16th, 2014

I’d like to raise a genuine “finance and economics” question that has been bugging me for a few days:

Why does Debt to the Penny show the national debt has increased by $1,002 billion over the past year, if the federal deficit is supposedly only $520 billion or so?

Calculated Risk sometimes does monthly posts about the Federal Deficit . (I think we’re about due for another one.) The tenor of these is usually “deficits are decreasing, all is well”.

In last month’s post cited above, we were told (by the CBO) that the deficit for 2014 will be 3% or less of GDP, after being just over 4% of GDP in 2013. 2014 GDP is 17,300,000,000,000 $ per year as of Q2. 3% of 2014 GDP is $520,000,000,000, or $520 billion.  4% of 2013 GDP is about $700 billion.

But the national debt for FY2013 and FY2014 has increased at closer to $1 trillion per year, as the chart below shows!

So what gives?

What’s happening with the other $482,000,000,000 in net borrowing this past year? That’s not exactly a small amount of money! Also, if people need tradesman vehicle finance, they can easily get them from here.

Growth-in-National-Debt-1993-2014

Footnote: We’re very near the end of the fiscal year, so the FY numbers should be comparable to the “past year” numbers. (In 2013 the change in debt from 9/16 to 10/01 (start of the fiscal year) was just $9 billion.)

Personal Finances without Quicken-type tools

Tuesday, May 20th, 2014

I don’t like having my personal financial data in someone else’s control. I used to use Quicken, and I also tried the system set up by Bank of America. Many years ago I ditched Quicken when it tried to start getting me to store my data online at their server, and ditched BofA out of outrage after the credit crisis scandals.

Additionally, having a credit card from the beginning is beneficial if you have no credit history because it can help you create one in the long run with responsible use. You can utilize a credit card to help improve your credit score, but before applying for a credit card, be sure you can afford the minimum payment, as most businesses will do a check to confirm you can pay at least that amount. When it comes to managing finances, I prefer to handle transactions directly rather than relying on third-party services, especially for important matters like Send money to Mexico.

I found a solution that works better for me, using a “buckets of money” budgeting approach plus modern electronic banking.

(1) Set up 3 checking accounts (including 1 at local bank, 1 at local credit union, 1 at national crime-syndicate bank) and 5 savings accounts (not at crime syndicate). Link accounts together with free ACH transfer capabilities.

(2) Use first checking account to just pay all the automatic monthly bills that don’t change size by much over the course of a year. (Telecom, electric/gas, water, daycare, car insurance, etc.) Set automatic payment into that account to cover the average monthly cost. Watch the level in the account to make sure it’s never less than 2 months’ expenses. Instant budgeting, plus 2 months’ savings cushion.

(3) Use 2nd checking account to cover non-automatic but routine spending (e.g. groceries, gas). Set automatic payment into that account to cover the average monthly cost. Watch the level in the account to make sure it’s never less than 2 months’ expenses; trim back as needed when level drops. Instant budgeting, plus 2 months’ savings cushion.

(4) 3rd checking account is for all “discretionary” purchases, fun, restaurants etc. plus all “non-routine” spending such as house repairs, medical costs, etc. Set automatic payment into this account based on budget for this type of stuff.

(5) The Savings accounts are used to save (!), in advance, funds for replacement of high-cost items: 1 for car replacements, 1 for major appliances, 1 for major vacations, 1 for everything else. 1 is to hold the other 4-6 months worth of emergency savings which isn’t in the checking accounts.

With these 8 accounts, I now have a multi-category quicken-type budget control system — without having to pay anyone for crappy software. I also keep nearly all my funds out of the giant banks, while still having an account there for when I need specific services which the smaller banks may not offer.

It’s a little more work to log in and track the accounts. But only one checking account (#3) requires any effort. The first two are set up so all I need to do is check whether the balance is where it ought to be, and either tweak the budget or adjust my spending if necessary. And for account #3, it’s much less work to sort out the expenses, when most of the payments are already separated out into #1 or #2.

A nice side benefit is that no single financial institution has all my data, so it’s harder to be profiled and abused.

“Secular Stagnation”, “Beautiful deleveraging”, and long-term growth

Monday, January 6th, 2014

The perennial debate about the health of the U.S. Economy has acquired a new catchphrase, “Secular Stagnation”, which I spotted at Beat the Press responding to an article in the New York Times. Dean Baker apparently agrees with Larry Summers that secular stagnation is real and is not just a consequence of the Great Recession of 2008-2009.

I think a very good case can be made that the secular stagnation clearly began sooner (and Summers evidently would agree albeit for different reasons). Ex debt growth, the U.S. economy’s growth rate has been abysmal for decades, a tale told in many ways including stagnating real median income, real median household income levels, and rising per-capita private-sector debt burdens. The stagnation appears to date back to at least the Clinton administration, in fact.  The economic boom during the Clinton administration was fueled by unsustainable financial practices. The Administration’s economic team included Summers and all the other Rubinites at Treasury and so on, and was complicit in both the creation of both the huge stock market bubble and the evisceration of Glass-Steagall and other sound, but restrictive financial regulations (CFMA comes to mind as well…). The deficit of financial prudence created a tremendous boom while it lasted, but left George W. Bush’s team facing a bust of historical proportions.

Unfortunately the deficit of financial prudence has persisted longer than the boom did, and the Bush team’s policy responses from 2000-2004 created their own dire aftermath in 2008. Feeling snarky, I might even say that the “prudence deficit” persists even today, among folks who claim that there isn’t a debt crisis, when the glut of credit creation (which leads to the low interest rates which these folks believe are okay) IS the problem and WILL BE the source of the next crisis, already brewing. This is not to say that within the credit bubble, there wasn’t also a mass financial mania as illustrated by the consequences of Lehman’s demise. Just that we are not done with all the adverse consequences of the credit bubble, and there is likely to be another great crisis as soon as the Obama Administration is unable or unwilling to kick the can any further.

The secular stagnation issue is aggravated by the reality that neither individuals nor economies thrive when total debt burdens (private, corporate and public) are three or more times the annual production rate… although such conditions are ideal for the rentiers collecting the interest and other rents without needing to be productive – at least until the low interest rates run into high default rates and force rentiers back to work!  But the eventual deleveraging (reduction of debt) punishes everyone, because when growth in credit slows or reverses, it no longer fuels growth in spending or production the way that it previously did.

The best we can hope for at this point is a “beautiful deleveraging”, consisting (per Ray Dalio at Bridgewater) of a combination of debt restructuring, austerity, money-printing and other transfers of wealth from rentiers and savers to debtors and wasters. Where “beauty” is simply that the deflationary side (restructuring and austerity) are balanced by the inflationary money printing. (Dalio did not mention in the link that one may also pursue policies to stimulate organic (debt free) growth in production, which also brings down the economic burden of high debt levels.)

It appears that the writers of the Federal Reserve Reform Act of 1997 were wiser than most of us nowadays, for they mandated this (emphasis added):

The Board of Governors of the Federal Reserve System    
and the Federal Open Market Committee shall maintain long run growth of the monetary and credit aggregates 
commensurate with the economy's long run potential to 
increase production, so as to promote effectively the 
goals of maximum employment, stable prices, and
moderate long-term interest rates.

Today, everyone who watches the Fed remembers the part about “maximum employment and stable prices” (though forgetting both “moderate long-term interest rates” and that inflation at 2%/year is not truly “stable prices”), but we often forget that the real goal is, wisely, to prevent long run credit growth in excess of the economy’s long run potential to increase production. Because excess credit growth over the long run becomes a credit bubble, credit bubbles are not sustainable, and the consequences take decades to resolve.  Which why we have secular stagnation and the best we can hope for is a “beautiful” deleveraging.

Far more beautiful would the world be, had the Federal Reserve and the Clinton, Bush and Obama administrations’ economics teams (including the regulators and the law enforcers as well as the policymakers) done more to help keep the ugliness of high debt out of the economy in the first place!

Digging in the Wrong Place

Tuesday, December 17th, 2013

[Raiders of the Lost Ark]

… The old wise man reveals writing on the back of the medallion for the Staff of Ra, which states that part of the staff must be removed before using it to locate the Lost Ark …

Indiana: Belloq’s medallion only had writing on one side? You sure about that?

Sallah: Positive!

Indiana: Belloq’s staff is too long.

IndianaSallah: They’re digging in the wrong place!


It seems to me that today’s Economics profession is “digging in the wrong place” – misreading the data and pursuing the wrong solutions.

Rather than print credit and deficit spend, what if we just enforced the laws governing competition a bit more strongly?

The Sherman Antitrust Act and related pro-competition laws need to be better enforced across large sections of the U.S. economy.  While there appears to this author to be enough price competition among the various international auto manufacturers (at least for the U.S. market), and also in computers/electronics, the same is not true of the majority of the economy. For many other major durable goods, for telecom services, for a wide variety of nondurable products and services (including TV, Radio and paper-based news!) there are really only a few corporate providers in any given market. (Did you know that just 3 companies control 9/10 of the market in soft drinks? That only 4 Pet Store chains have nearly 2/3 of the market share? And don’t even get me started on healthcare…)  Utilities are already regulated as local monopolies — but is the regulation truly pro-consumer?

A closer look is needed at consumer products, particularly in foods, and even including restaurant chains. A relatively small number of corporations are hiding behind myriad brand names. When one pulls back the veil of brand-name marketing and takes a close look at the corporate ownership and cross-linkages, the true picture is pretty grim. (My kids have earned my respect as good consumers by carefully reading the labels on the packages in the fridge, and saying words to the effect of “Oh no, it’s Kraft again!”) Furthermore, it’s clear from price trends (despite 5 years of very difficult economic conditions) that pricing power is being exploited. There’s also a lot of evidence of corporate titans buying up young upstarts, ostensibly to acquire new capabilities, but also having the net effect of suppressing new competition. Moreover, in the dynamic landscape of corporate maneuvers, there’s a noticeable trend in various industries, such as SEO services, where corporate titans are strategically acquiring young upstarts, ostensibly to gain new capabilities but also with the underlying impact of suppressing emerging competition. In addressing these issues, it is imperative to consider the implementation of effective Chicago SEO Scholar strategies to enhance visibility and competitiveness.

So perhaps economists should reconsider the idea that the U.S. economy might be suffering from a “shortage of competition”, with too many sectors dominated by “pricing cartels”. That idea has tremendous explanatory power to describe the overall economic situation.

Even without explicit cartel or monopoly power, it’s possible for corporations to act cooperatively against the national or consumer interest. (One can look at their industry-based lobbying outfits in Washington for more examples…) When corporations in less-than-competitive industries all push for higher prices (and lower wage expenses) and the result is maximum profits industry-wide, the consequence is that fewer goods (and services) are produced and sold. Supply is constrained by the high prices, and demand constrained by low wages, particularly when large swathes of the economy are affected.

This “high-price/low-demand equilibrium” has many observable consequences. With supply and demand both constrained, total output is below capacity, which means fewer workers are needed and unemployment stays elevated while median income lags. Corporate profits are at record highs as a share of GDP, yet household incomes are not improving. The same economic power which produces high prices and record profits/GDP also produces favorable tax laws for the corporations. With corporations and the very wealthy avoiding taxes, and households earning less federal tax receipts are reduced. The non-rich, suffering from declining standards of living, demand help. So the government deficit-spends to provide that help, and also to bridge the demand and employment gaps. All of these consequences are observed today.

If this is right, then the cure for the economy as a whole is not to be found in monetary or fiscal policy, but simply in nonfinancial policies aimed at increasing competition!

Increasing competition leads to lower cartel profits in the short term, but leads to increased employment and a healthier, more prosperous economy overall. When more companies compete to provide goods and services in a given market, they must provide the goods at lower cost and higher quality. With prices being lower, sales rise, and to produce the increased quantities being sold, more people must be employed. The workers can then afford to purchase more, creating a virtuous loop which results in much greater output and in fact much greater profits in the long run. Those would be Sustainable Gains!

This sort of argument is well-known from classical economics. There is a good explanation (in a historical context) in one of J.K. Galbraith’s books or essays, although I don’t recall which one. The concept goes back at least to Adam Smith, according to the treatment on Wikipedia. It is unfortunate that modern economists appear to neglect the issue. Do they think there is no need for economic policymakers to deliberately foster ample competition among producers?  Or do they simply assume that corporations will find ways to compete effectively without government intervention?  The evidence suggests that corporations, left to their own devices, concentrate more pricing power than is in the national interest.

Systematic Bias in Weekly Unemployment Claims Data

Friday, December 13th, 2013

The systematic bias in the weekly unemployment claims data has been increasing in recent years. Every week the BLS reports weekly claims to great fanfare, and at the same time the BLS quietly revises the previous week’s claims. The “preliminary” new data is compared against the revised “older” data to advertise any directional change. However, the data show that the revisions are almost always upwards, which is statistically impossible if the original claims estimate is done honestly.  In practice the result is that the media receive a report which compares the current lowball number with last week’s upwardly-revised number, and dutifully report “unemployment claims drop”. However, a large part of the time this simply isn’t true; the initial number is just wrong and claims are simply bouncing around.

I’ve done these types of analyses myself several times in the past several years and always found the systematic bias maddening. See my Oct 2012 comments on Economist’s View (reposted below).

The situation reminds me of how sometimes a store will raise prices (say by 20%), then mark the product as “On Sale” (say “10% off”) and fooling the buyer into thinking they’re getting a good deal.

I can understand the value of this sort of behavior in a competitive retail market, but we should expect more from our economic statistics. And from our news sources. Any workers in a discipline that claims to be a science (e.g. econometrics) or to be objective and factual (e.g. serious journalists) need to be really aware of these sorts of errors, and work to eliminate them.

I’m glad to see this issue is getting more attention.

——————————-

Reprint of comment from October 2012 on Economist’s View (during the brouhaha surrounding the allegedly fraudulent pre-election employment situation report):

The BLS would have far more credibility if they did not frequently report misleading headlines that “weekly unemployment claims decrease”. Their practice of comparing current-week preliminary (lower) claims against prior-week revised (increased) claims invariably fails to mention the amount of the upward revision.

The weekly claims series has flatlined for essentially all of 2012, but not at a level consistent with strong employment growth. See CalculatedRisk for the plot:http://www.calculatedriskblog.com/2012/10/weekly-initial-unemployment-claims.html

Every single week, the prior week’s preliminary estimate is revised upward. See the table below. This makes the current week’s number look better in comparison, since the current week’s number has not _yet_ been revised upward. This is not simply a statistical outlier, but a systematic error which acts as a propaganda tool.

It is not uncommon for this fraudulent comparison to cause errors in the reported _direction_ of the change from the prior week. There are weeks when the claims are increasing (on an apples-to-apples basis), but they are reported as decreases because the comparison is made against the revised data. For instance, the report for the week of March 24 claimed a “decrease” in claims from March 17, but in fact the claims had increased. Again, see the table below.

Under the general premise that “there is never just one cockroach”, the presence of this statistically indefensible data series leads all reasonable observers to be skeptical of everything else put out by the same organization.

Date Initial Revised Increase(+) or Decrease(-)? ** = Flagrantly Wrong Headline
12/31/2011: 372,000 375,000 +
1/7/2012: 399,000 402,000 + large “jump up” due to seasonal adjustment error?
1/14/2012: 352,000 356,000 + large “drop down” due to seasonal adjustment error?
1/21 377,000 379,000 +
1/28 367,000 373,000 +
2/4 358,000 361,000 +
2/11 348,000 351,000 +
2/18 351,000 353,000 + ** increase made to look unchanged
2/25 351,000 354,000 + ** unchanged made to appear as decrease
3/3 362,000 365,000 +
3/10 351,000 353,000 +
3/17 348,000 364,000 + Anomalously large upward revision makes subsequent data look better
3/24 359,000 363,000 + ** increase made to appear as decrease
3/31 357,000 367,000 + Anomalously large upward revision makes subsequent data look better
4/7 380,000 388,000 + large “jump up” due to seasonal adjustment error?
4/14 386,000 389,000 + ** increase made to appear as decrease
4/21 388,000 392,000 + ** increase made to appear as decrease
4/28 365,000 368,000 + large “drop down” due to seasonal adjustment error?
5/5 367,000 370,000 + ** increase made to appear as decrease
5/12 370,000 372,000 + ** increase made to appear as unchanged
5/19 370,000 373,000 + ** unchanged made to appear as decrease
5/26 383,000 389,000 +
6/2 377,000 380,000 +
6/9 386,000 389,000 +
6/16 387,000 392,000 + ** increase made to appear as decrease
6/23 386,000 388,000 +
6/30 374,000 376,000 +
7/7 350,000 352,000 + large “drop down” due to seasonal adjustment error?
7/14 386,000 388,000 + large “jump up” due to seasonal adjustment error?
7/21 353,000 357,000 +
7/28 365,000 367,000 +
8/4 361,000 364,000 +
8/11 366,000 368,000 +
8/18 372,000 374,000 +
8/25 374,000 377,000 + ** increase made to appear as unchanged
9/1 365,000 367,000 +
9/8 382,000 385,000 +
9/15 382,000 385,000 + ** unchanged made to appear as decrease
9/22 359,000 363,000 + large “drop down” due to seasonal adjustment error?
9/29 367,000

P.S. It is most interesting that the “preliminary” data upon which the headlines are based is not tabulated with the revised data. One must read each press release and copy the numbers to see this effect. Sorry if my tabulation is not as clean as it could be.


Housing Bubble Pain Continues for Most Americans

Monday, November 18th, 2013

Here’s a table, compiled by former Fed Governor Larry Lindsey and circulated by Marc Faber, that explains much of the pain from the housing-bubble collapse. The lower 75% of households (by wealth) have still not recovered their peak wealth.

HouseholdNetWorthImpactByWealth-2007-2013-Lindsey

http://www.portphillippublishing.com.au/DR20131118c.jpg

This is exactly what I was getting at in a recent comment on Macroblog; copied below. I’m glad to see more folks are looking into this.

But I fear that now it’s too late; the next bubble is already upon us now, and no one in a position of authority was willing to take away the punchbowl early enough.

MacroBlog Comment by Sustainable Gains on 10/24/2013:

Don’t forget the fraudulent nature of the house price increases in much of the country.

In many many places, according to eXp Realty experts, loans were issued and properties flipped because lenders and/or borrowers were blatantly writing fraudulent loan paperwork. Prices were inflated above sustainable economic value as a result. Those who sold received ill-gotten gains; those who bought and held were forced to pay higher prices than they should have – they were robbed. Those who flipped paper received ill-gotten gains; those who bought the AAA-rated bonds and didn’t get their interest or principal back were robbed. Those who borrowed against the higher, fraudulent prices, thinking that rising prosperity and declining rates would make refinancing later affordable, were tricked too. In fact, never in the course of human events have so many been robbed so badly, by so few.

Wondering why the eventual collapse was so painful is a ludicrous pastime for “economists”. The net worth of the overwhelming majority of Americans is entirely in their home equity. Or was. Many folks lost their entire net worth. Rebuilding that takes time in the best of circumstances, and even more so now, given the structural problems in the economy. Furthermore, many of these folks were burned so badly that they will refuse to partake in a repeat.

The Federal Reserve, among many other institutions, was AWOL when it should have been regulating to prevent all of this. Greenspan is recently on record claiming that fraud is a law-enforcement issue, not a Federal Reserve issue. That is nonfeasance [by Greenspan and the Fed]. The Fed has regulatory powers, and anything that leads to “bezzle” on the balance sheets (to borrow a term from J.K. Galbraith) is also a regulatory issue, because it means banks haven’t got the capital base they claim to have. There was plenty of evidence available to those willing to look for it.

I suspect that 100 years from now, History is not going to look kindly on anything the Fed did from about 2002-present.

The Bubble This Time

Tuesday, October 29th, 2013

For those who look, there are many clear signs of credit/housing bubble 2.0:

  1. Extreme levels of student loan debt (and rising rates of delinquency);
  2. NYSE Margin Debt pushing to new extremes;
  3. Covenant-Lite corporate debt issuance (high risk to lenders) hitting new extremes while interest rates remain abnormally low;
  4. Extremely high proportion of houses being bought by investors paying “cash” (aka pre-funded borrowing) rather than resident owners;
  5. House prices pushing back up toward the bubble peak, while affordability metrics drop;
  6. Corporate earnings/GDP well above sustainable levels (at the expense of high trade and government deficits, and low household savings rates;
  7. Rising income and wealth inequality since the newly-minted credit is unevenly distributed.

Taking the list in detail (links only for now; will put up the linked charts later):

(1) Student Loans – U.S. Dept of Education, Sept. 30 press release and FRED Graph of Federal Student Loans

(2) NYSE Margin Debt – Analysis by Doug Short

(3) Covenant-Lite Loans – Bloomberg article on Fed Warning to Lenders

(5) House prices rising in echo of earlier bubble – charts posted by Calculated Risk

(6) Corporate earnings vs. GDP – This is a reflection of unsustainable deficits elsewhere in national income accounting; excess corporate profitability leads to stock price bubbles, since the earnings are not sustainable without genuine median income growth – See the St. Louis Fed’s National Economic Trends report.

Footnote #1:  I haven’t located quality plots for items 4 and 7 at this time.

Footnote #2:  Smart traders can make a lot of money in a bubble.  That’s part of the process by which they happen.  But if the gains aren’t sustainable, the bubble is a net expense to the nation due to malinvestment and maldistribution. And it’s not an ethical time to invest if the outcome is a “negative sum game” (that is, if your gain means someone else loses worse).


“Econoganda”

Thursday, October 24th, 2013

Econoganda, n: What you get when “Economists” engage in Propaganda.

Econogandist, n: A person who produces Econoganda.

Examples: The popular works of most politically-driven “Economists”. Krugman, Mankiw, DeLong, half the posts on ZeroHedge, etc. The folks who decide to be pundits with an agenda, instead of scientists.

If these people were real Economists, they’d be more interested in finding a true scientific foundation for their field — not in pushing particular policy agendas. Especially 5 years after their theories were all invalidated by poor predictions.


Update 11/20/2013:

pro·pa·gan·da:  noun

ideas or statements that are often false or exaggerated and that are spread in order to help a cause, a political leader, a government, etc.

1 capitalized : a congregation of the Roman curia having jurisdiction over missionary territories and related institutions

2 : the spreading of ideas, information, or rumor for the purpose of helping or injuring an institution, a cause, or a person

3 : ideas, facts, or allegations spread deliberately to further one’s cause or to damage an opposing cause; also : a public action having such an effect

— pro·pa·gan·dist noun or adjective
— pro·pa·gan·dis·tic adjective
— pro·pa·gan·dis·ti·cal·ly adverb

Examples of PROPAGANDA

He was accused of spreading propaganda.
The report was nothing but lies and propaganda.