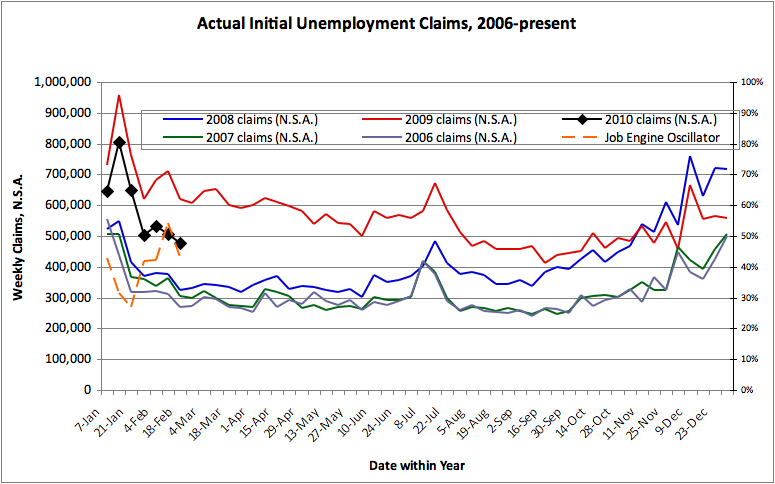
This chart uses the style of my patented(*) Weekly Claims reports, and applies it to another series with strong seasonal variation: New House Sales(**). The actual data are used (without seasonal “adjustments”) and plotted in context to allow comparisons (without needing “adjustments”). Historical data are included back to 2004.
This chart shows something that is well known, and puts new perspective on something less well known, and a bit disturbing. First, we see that sales peaked in 2005 (and just to be safe, 2004 is plotted with dashes). And, for each month from 2006 until late 2009 each year’s sales was weaker than the prior years. This much was well known. Today’s release on January 2010 sales is disturbing. The actual number is lower than in 2009! (2009 was, until now, lower than any prior data point back to the start of the series in 1963. Prior to 2010 (and 2009) the low for January was 28 thousand homes, back in 1982. And the population and number of households are both much larger today.)
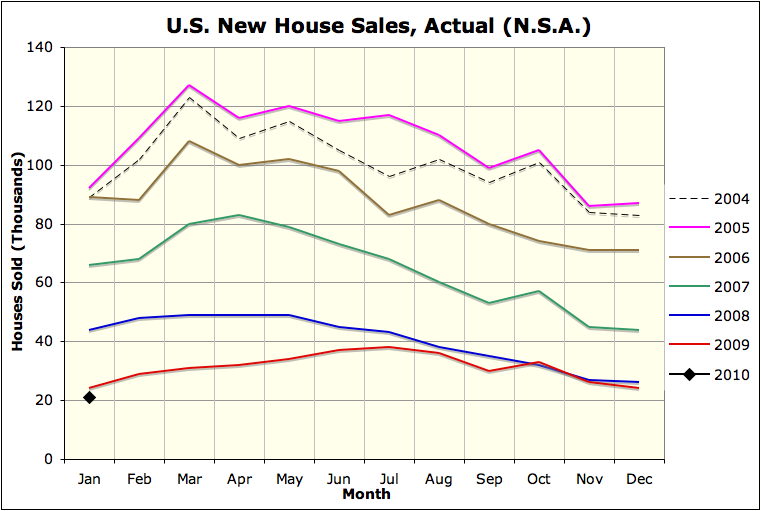 This new data suggests that the government’s attempts to prop up demand for houses are failing. Perhaps, in order to improve demand for houses, we need improved business and employment conditions? Tax gimmicks can induce some people who were ready to buy a house to do so earlier, but in the long run people will not buy many houses unless they are confident they will earn enough to make the payments. Furthermore, the market must be stable enough that people will not worry about suffering large capital losses if a personal crisis forces them to sell unexpectedly. Both of those require less one-time government market intervention, which doesn’t sustainably stabilize either jobs or prices, rather than more! It is unfortunate that neither the Realtors nor the Homebuilders seem to grasp this point, since they appear to have the attention of Congress, yet they have repeatedly asked only for tax gimmicks, rather than sustainable solutions…
* – Just kidding… but I do think it’s a good style for this class of data!
** – It takes more than just a structure to make a house into a home, so I reject the term “New Home” sales. (You can buy & sell houses, but you have to <i>make</i> your home – yourself!)