Archive for January, 2010

Preventing the Next Crisis? Automatic Stabilizers?

Monday, January 25th, 2010

Apropos of the current fears of another market panic in 2010, and a new topic for Do Not Feed the Squid fans: “How can we arrange economic matters differently, so that we do not have another crisis, either soon, or ever?”

There was an interesting discussion of the concept of “Automatic Stabilizers” to provide countercyclical fiscal policy, but like all other policy responses I don’t think auto-spending plans or other “stabilizers” will help to prevent future financial excesses. Centuries of financial history, as retold in books such as “Manias, Panics and Crashes” by Kindleberger, tell us that crash-preventing and crash-mitigating policy constraints tend to be undone by the same economic and political forces that lead to the financial excesses. It is not enough to imagine stabilizers, they must be implemented, and they must be implemented in such a way that they remain effective without being evaded or gamed.

Perhaps the best stabilizer is a system which doesn’t tend to excess in the first place, so that the resulting crashes are not so severe. The Founding Fathers, within the constraints of the 1700s, were not unwise in this regard – Article 1 of the U.S. Constitution actually has the simplest of all financial stabilizers, demanding that only gold and silver coin may be used as tender for debts (Section 10), authorizing only Congress to borrow money on the credit of the United States (Section 8), empowering only Congress to coin money (Section 8), and that “No money shall be drawn from the treasury, but in consequence of appropriations made by law” (Section 9). Congress has managed to mismanage this. Why should they be expected not to muck up any other “automatic stabilizers”? (An interesting side note — the rest of the Constitution does not even mention money.)

Now, the 1800s had plenty of financial ups and downs, and politicians (seeking always to take credit for trying to make things better?) have muddled with the system, so that despite the constitution gold and silver coin are no longer money, Congress has delegated a lot of financial responsibility, and savers seeking to invest must deal with a lot more “political risk”… Meanwhile, financial crises still occur, and they are certainly more complex now, but are they any less severe?

This sort of thinking led me to the following rant, which I want to post here for posterity:

We HAD automatic stabilizers! But the problem with “automatic stabilizers” is that, in a credit mania, the political process leads to the dismantling of the stabilizers. How many defensive mechanisms were put in place after the Great Depression, and then dismantled in the 1990s and early 2000s, again? We had banks that could be “failed out” via the FDIC. We had Glass-Steagall separating speculation from honest lending. We had lenders who had to own the risks of their own lending, not pawn them off via “securitization” (what an oxymoron! no one was made secure!). We had a whole alphabet soup of regulatory agencies.

We HAD automatic stabilizers. But we threw them away! The regulators allowed both commercial and investment banks to hide toxic debts “off balance sheet” (as though, in reality, there could even be such a thing?). We let the banks leverage up well beyond historically prudent levels, ignoring centuries of financial history and thinking “it’s different in our time” (I.D.I.O.T. thinking). These failures were systemic and widespread and they did not come out of nowhere for no reason. They occurred because a long reign of prosperity had led to complacent outlooks. They occurred because an overly complex system was built up to hide the sausage, and the new system permitted trillions of dollars in hidden fraud (Galbraith’s “Bezzle”). They occurred because the people asking for the bending of the rules were making gobs of money, and the people who had the authority to say no, in far too many cases, were too interested in sharing in those gobs of money and not sufficiently interested in protecting the public interest. They occurred because too many people were too enthralled with fancy new marketing terms, and the few who were sufficiently quantitative and skeptical to realize that a “credit default swap” is the same as an insurance contract (and thus out to be regulated as such) were outvoted.

We had automatic stabilizers, and when we actually needed them, they weren’t there anymore. And probably in 60-80 years the automatic stabilizers that we will put in place will also be thrown away, and in 70-100 years there will another enormous crisis. Unless we truly do something different this time. But the gridlock in Washington and the entrenched resistance on Wall Street doesn’t give one any reason for optimism.

Why is it, again, that everyone who created this mess is still in power? Why are the same regulators now expected to actually enforce prudent fiscal responsibility, whose nonfeasance enabled the runaway banks to drive us to the brink of ruin? Why is the same clique of bankers still in charge of the “too big to fail” institutions, that failed and were bailed? Why are the same Congresspeople in charge, who failed to exercise their proper oversight of the executive branch agencies and ensure that regulation actually took place? Why is it that the Federal Reserve is being allowed to purchase outright securities that are not “full faith and credit” obligations of the United States Government, despite the very clear language in the Federal Reserve Charter limiting the Fed’s authority only to those securities? Where are the protests at the TARP vote (against the will of the vast majority of those willing to contact their Congress)? Where are the riots against the indentured servitude our children and grandchildren will face, paying interest on $15,000,000,000,000 in debt that they did not ask for and which does them no good? (Those used to be “astronomic” numbers… now they are “economics” numbers!)

Oh… we haven’t DEMANDED either manual OR automatic stabilizers, yet.

The crisis will continue until the national response improves.
Weekly Claims, Jan. 21, 2010

Thursday, January 21st, 2010

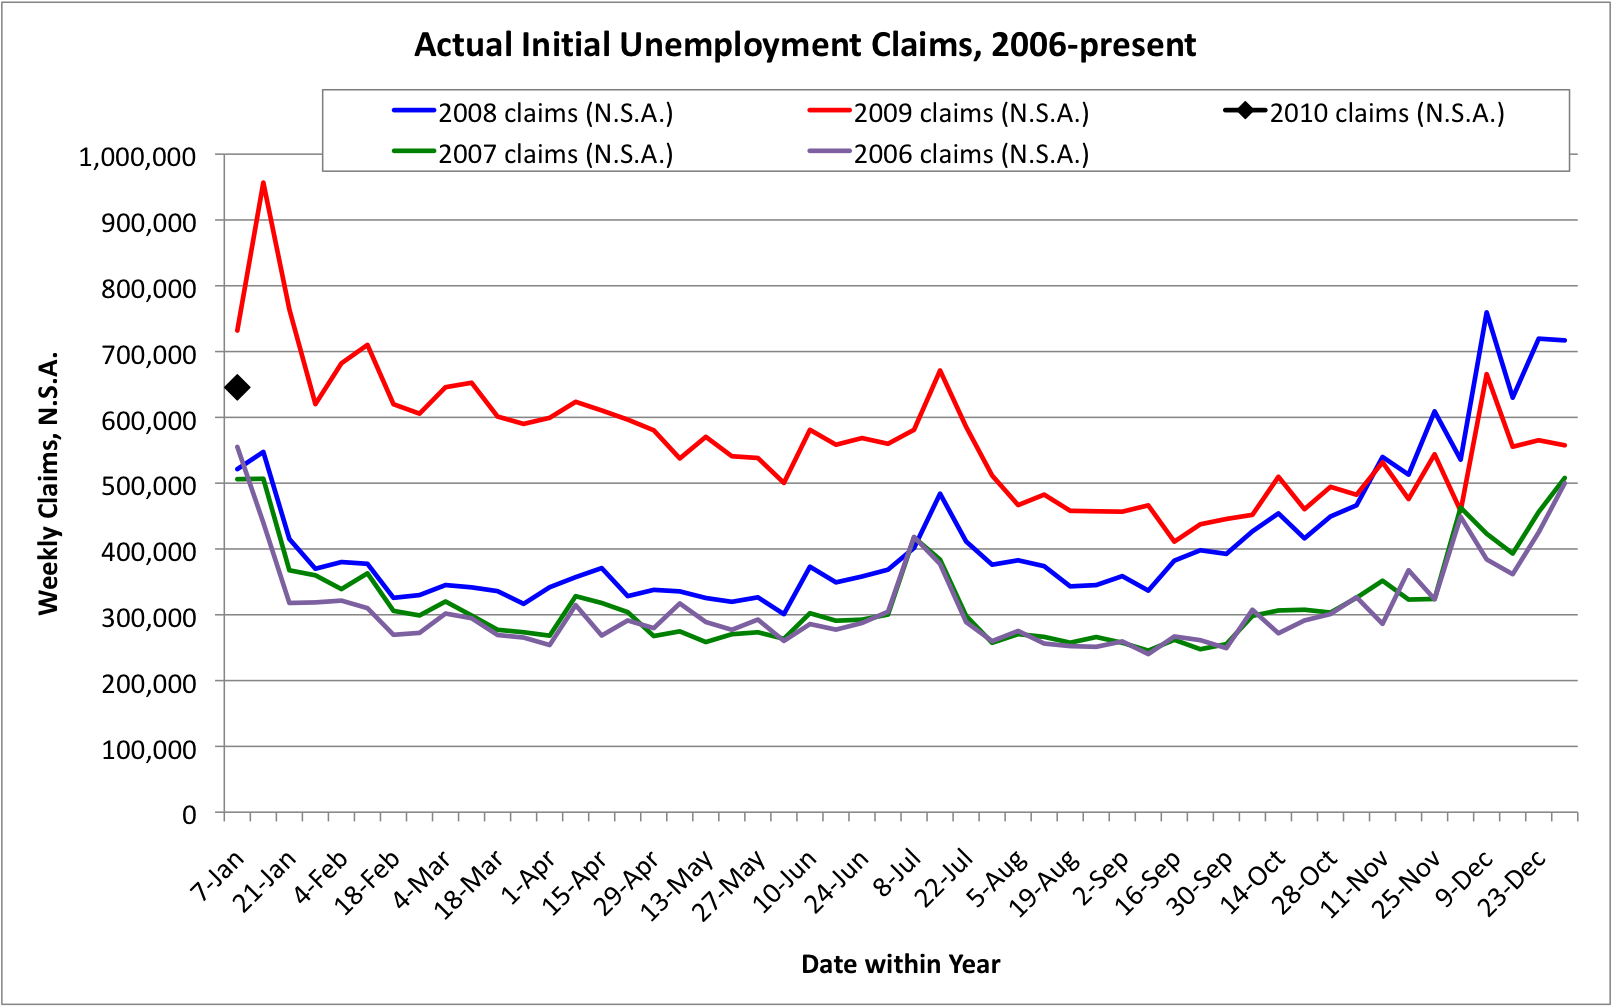
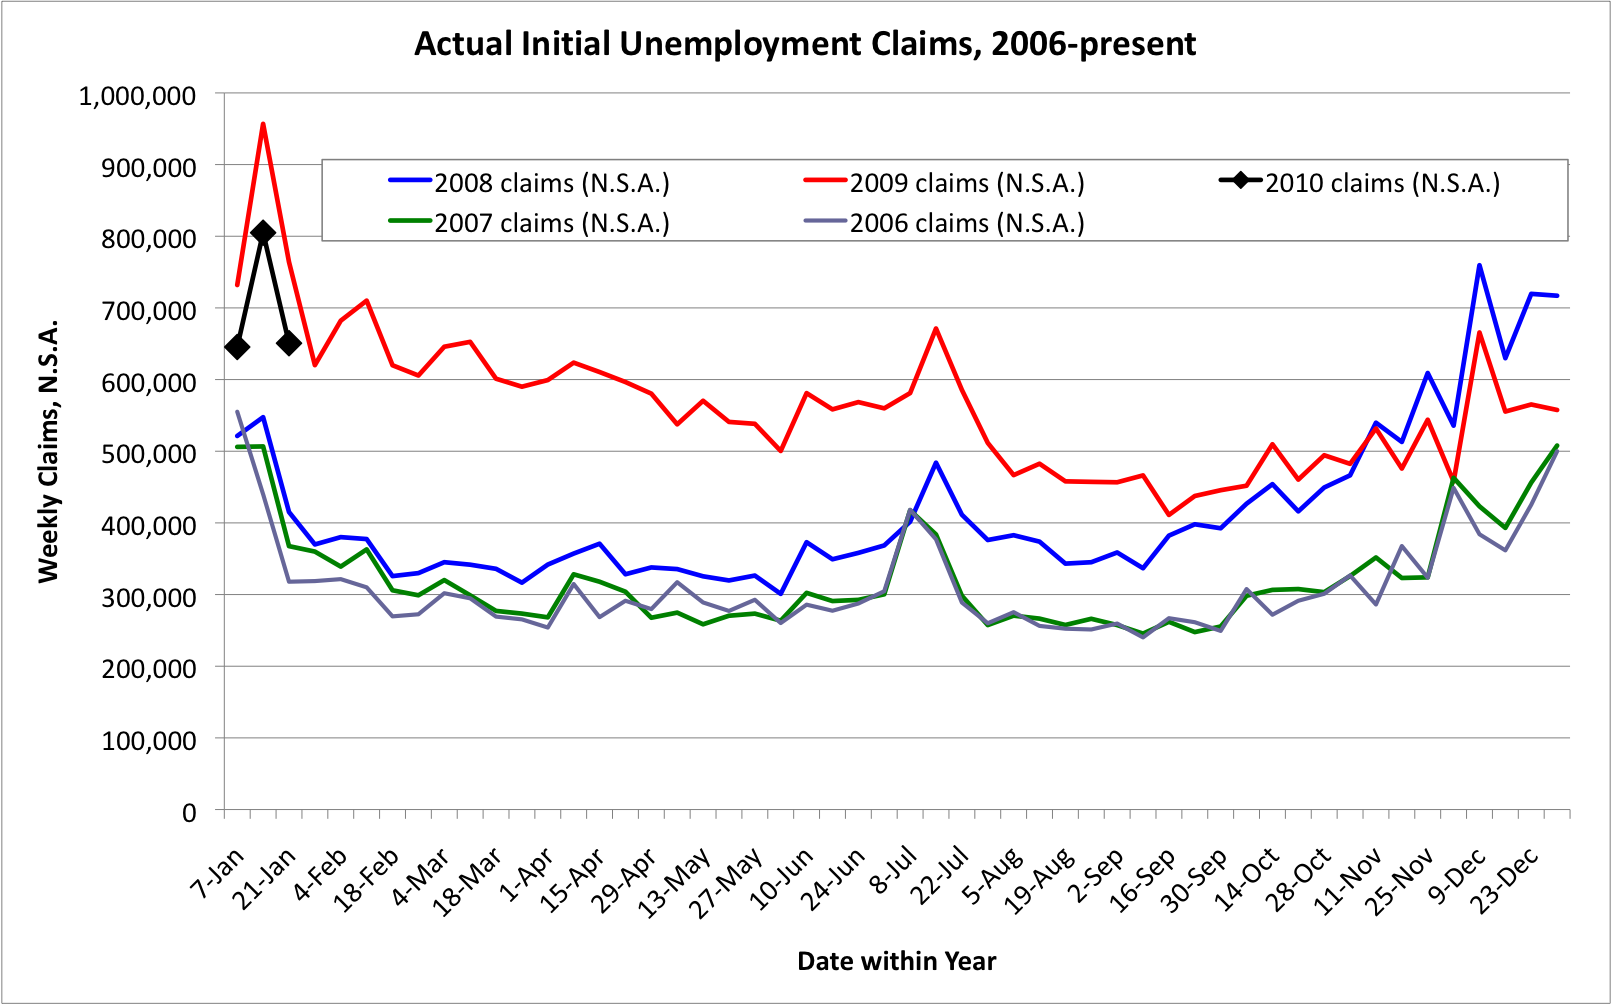
The claims data remain quite weak. Although this week’s claims were lower than last week’s, that’s just the seasonal pattern. The problem is that the three points for 2010 are only slightly better than the data from the same three weeks in 2009. The 2009 data were horrifying, and the 2010 data are too close to the 2009 data, and too far from the 2006-2008 “healthy job market”, and nowhere near indicating “recession over”.

Update: In late 2009 the data started returning to the “healthy” 2006-2007 levels, but that trend seems to have reversed. In fact, if things continue we might see 2010 data <i>worse</i> than the 2009 data.  (But I hope this doesn’t happen!)

Click on chart for larger version:

Weekly Unemployment Claims, N.S.A., 2006-present, 2010-01-21

Restoring the Federal “Reserve”

Thursday, January 14th, 2010

[Comment originally posted at <a href=”http://macroblog.typepad.com/macroblog/2010/01/when-independence-begets-accountability.html?utm_source=feedburner&amp;utm_medium=feed&amp;utm_campaign=Feed%3A+typepad%2FRUQt+%28macroblog%29″>Macroblog regarding “When Independence Begets Accountability”</a> ]

The Federal Reserve should get back to its traditional role as quickly as possible, and cease trading in markets for anything other than full-faith-and-credit obligations of the United States. This includes Fannie/Freddie debt!

The more complex role that the Fed has taken on in the past 1-2 years is too politically charged, and should be abandoned. There are many other ways that the government can react to a financial crisis. If the Fed’s retreat creates a gap in the policy options, put that issue on the table. But don’t put the Fed into the gap.

The Fed should pull back from the “regulatory” roles that it’s supposed to have. That hasn’t worked out properly, and it overly entangles the Fed with the banks. The Fed was so entangled that it couldn’t take away the punch bowl at the right time. If the Fed cannot do that well, it certainly cannot afford to take the blame for failing. Let someone else have that job, but protect what is essential about the Fed.

The Fed should not be an agency of anything other than pure monetary policy. It should simply manage the elastic money supply.

The Fed should be made far more independent of the banks that it interacts with. The only way to be able to take away the punch bowl is not to be drinking at it, and not to be buddies with the drinkers either.

It’s time to restore some honor and dignity to the system.

Weekly Claims, Jan. 14, 2010

Thursday, January 14th, 2010

This does not look good!  The second week of January is now tracking much closer to 2009 (red) and not returning to the 2006-2008 levels.Weekly Claims 2010-01-14

“Limited Maximum Drawdown” Investing Approach

Tuesday, January 12th, 2010

Investors are typically most sensitive to portfolio “drawdowns”; those periods when, on balance, the investments are worth less than their peak. “Drawdown”, commonly used by hedge funds, refers to the percentage that a fund’s Net Asset Value (NAV) is below peak. We don’t pay hedge fund managers, but it helps to think like one*, and the “drawdown” concept is quite useful.  We strictly limit our maximum conceivable drawdown to ensure we do not jeopardize our investing/savings goals.  We then manage our portfolio accordingly.

Our first step is to monitor our own NAV. This just involves summing up the value of all holdings periodically (weekly), and tracking inflows and outflows. We use an imaginary number of “shares” and then pretend that each inflow/outflow is “buying” or “selling” some shares in our “personal hedge fund”. Meanwhile, market-driven changes in portfolio value push the NAV ($/share) up and down. After a few hours of setup, having our own NAV is trivial with a spreadsheet.

Now, given a NAV and a drawdown limit, one starts to invest rather differently.

First, the drawdown limit forces conservatism when it is most needed: when things are going badly. With a drawdown limit, there is no “doubling down”, Martingale doom path. When things go bad, you have to get into zero-risk assets and let the yield rebuild NAV before you take on risk.  For those with a trading appetite, this provides a “reset” time to get back in the groove. For those without a high risk-appetite, it provides a “nerve-soothing” time to re-assess the market before getting back into risky assets.

Second, it leads one to ask whether a given investment is really the best way to get the intended return, because other methods might deliver the same return with less drawdown risk. For instance, a ladder of individual Treasury bonds held to maturity has zero drawdown, whereas a bought-and-held intermediate Treasury bond fund can swing by many percent — yet both deliver similar yields. Similarly, it leads one to ask when and how buy-and-hold is a sensible option for stock-market money.  Suppose the maximum drawdown limit is 10% and the stock market has just shown that it can move down 50%.  Chasing performance and buying back into a broad market index after a long bull run puts a lot of drawdown risk into the portfolio – with more than just 20% of assets in a market index, a 50% crash hits the drawdown limit!  But chasing performance is a dumb strategy for a buy-and-hold 401k type fund. Maybe it would be better to buy dividend-yielding stocks whenever they are near 52-week lows, and then carry them in the portfolio only at purchase value, while harvesting the dividends and only noting the capital gains when “profit taking” time comes?

Third, it leads one to reassess asset allocation across the portfolio, and look into sensible market timing strategies. Correlated drawdown risks are most deadly, but also hidden from sight. The sales pitch for Modern Portfolio Theory was that diversification reduced volatility without greatly impairing returns. That was thoroughly disproven from September 2008 to March 2009, when the only assets that didn’t plunge 10% or more were U.S. Treasuries and cash readily exchangeable for them. A simple 75/25 Stock/Bond index method outperformed most MPT-diversified portfolios (though still having a horrific drawdown). Those who used tactical asset allocation based on things like 200-day moving averages did much better still.  MPT may reduce portfolio variability in bull markets, but it’s no defense in a liquidity panic, when everyone else has the same “exotic” investments and needs cash fast.

All of these effects are right in line with the “Investing for Sustainable Gains” philosophy.  And our claim is that a drawdown management approach, implemented well, can deliver long-term total returns comparable or better than other approaches, without jeopardizing one’s financial goals. We will explore some of these ideas in future posts, and if there’s interest, we can post some performance results from time to time as well.  (We will have 3 years of data to show at the end of March.)

– W.S.

* Hedge fund managers only get paid the big bucks (the 20% of total returns, measured by peak NAV) when they are pushing peak NAV up and having minimal drawdowns.  Drawdowns more than 10-20% tend to cause fund investors to pull their money from the fund. Also, looking at the long period of strong performance that is typically needed in those circumstances just to get back to peak NAV, many fund managers realize they won’t get paid big bucks again for a long time, and simply shut down the fund. But individual investors don’t have the luxury of “pulling their money out of their portfolio”, nor can they “shut down” their portfolio. We are stuck with our portfolios! So we believe in not taking excessive losses in the first place.  After all, we’re managing Our Own Money, not OPM!

Labor Force Participation Rate Decline: Expected, and Bad News!

Saturday, January 9th, 2010

I’ve had this unscratchable itch after reading CR’s post about the labor force participation rate decline.  I wanted to know how labor force was defined (in the U.S., it’s everyone 16 and up minus students and a bunch of other exceptions), and whether the declining participation was related to the boomers hitting retirement age (or at least, early-retirement age), as opposed to their kids maybe not being so numerous to make up the difference.  At first glance, not so…  I went over to Wikipedia and found the population pyramid from the 2000 census data, which showed that the generational cohort currently entering the workforce is larger in number than the boomers.  Also, only the leading edge of the boomer population is in the 55-64 age group now, where early retirement might make sense for large numbers.

So I went looking for more information.  The BLS has a very nice economist named Mitra Toossi, who publishes reports every couple of years analyzing the labor force.

The most recent report (PDF alert) came out in November 2009.  Not too far back!  It says, on the first page, “the aging of the labor force will dramatically lower the overall labor force participation rate and the growth of the labor force”.  

I can see this.  The population aged 65+ is getting larger compared to the population aged 16+.  And those over 64 are less likely to be labor force participants.  Similarly, the population aged 55-64 is “booming” right now, and they are also less likely to be labor force participants (e.g. kids thru college and house paid off, so a lot of folks have more choices about whether or not to work…)

But then I ask myself, how much of this is “prediction” and how much is rear-view-mirror economythics?

So I open up the same report but from November 2007 (the previous version).  It says “BLS projects that the labor force participation rate will be 65.5% in 2016.”  That’s a no-growth prediction from the rate prevailing in 2007.  The all-time high was 67.1% in 1997 (or 67.3% in 1999-2000 if you look at their data (possibly revised since 2007)… The participation rate dropped to about 65.5% in 2004 after the dot-com recession.

More from the article:  “projected continuation of the decrease in the labor force participation rate of youths…”

“once the baby boomers exit the last years of the prime age group and enter the 55-and-over group, with participation rates roughly half that of the prime age group, the overall labor force participation rate will decline significantly…”

So it seems that some of this “labor force participation decline” was anticipated prior to the recession, and it’s just demographics.  If the marginal benefit from working is reduced (lower pay, less pleasant work environment), some folks who don’t HAVE to work right now, will wait for a better chance later.

On the other hand, given that the decline in participation was forecast years in advance, shouldn’t policymakers have anticipated a deeper recession that normal just from the workforce demographics?  And perhaps more importantly going forward, since we know the boomers are going to be retiring en masse over the next few years (many with their belts fully tightened by the recession) doesn’t this imply a very weak recovery?  If workforce participation is going to be declining even in good times, the number of willing workers will be suppressed, and might even decline outright, even if total population remains stable to slightly increasing.  (It doesn’t help that the 2000s were a weak decade for population growth, with no sign of improvement, either.)  After all, it’s a mathematical identity that GDP is the product of the size of the workforce, the hours per worker, and the productivity per worker…  Size has some headroom due to layoffs, but not as much as it would if population were booming.  Hours are stagnant and honest-work productivity may be plateauing due to computer technology reaching the saturation point…  All of which points to weak growth in the U.S. for a while, which is not bullish for optimistic P/E multiples in the stock market.  Nor for bond default and/or rollover risks, with a lot of bond issuance predicated on perpetual-growth thinking…

Ruh-Roh!  The economy may have had “enough!”

W.S.

A Quick Guide to Squid-Free Banking

Thursday, January 7th, 2010

Over on Calculated Risk, a commenter asked:

So I have a checking account with Citi. Use it mainly for direct deposit and some bill paying. If I wanted to move to a small local bank, how would I find a safe one in my area(LA/OC)? I’ve tried searching online to find some kind of list or ranking of small banks, but could never get anywhere.

I replied with the following:

Three suggestions, but you’ll have to find what works for you on your own:

First, you can check with the National Credit Union Administration: Find a Credit Union
… if you are so inclined, you can actually view each credit union’s detailed financials. The credit unions are nonprofits (AFAIK) and tend to lend locally. They are all federally insured, much as banks have FDIC insurance. You can even check each CU’s local vs. nonlocal lending in the financials, after doing some homework.

Second, you might try looking on bankrate.com to find out which banks are lending in your area. Some of them will be small local banks.

Third, you might try here: Find Bank (and enter something like “metro:los angeles”). The list that comes up will be sorted by size (total loans, right hand column). Scroll down to find the smaller banks, then look at the detailed bank reports on the site… try to find banks with a lot of “green” stats (healthier than average).

Finally, when you do pick a bank, make sure they’re not on the list that CR posts weekly, or on this list: Troubled Bank List

Good hunting!

P.S. Another commenter chimed in with http://moveyourmoney.info/ . Personally I think my method is more “safe and sound”, but it also requires more work. The good news is that there’s clearly a market for this kind of information, so I expect more sites will be supplying it!

Update on Weekly Claims, Jan. 7, 2010

Thursday, January 7th, 2010

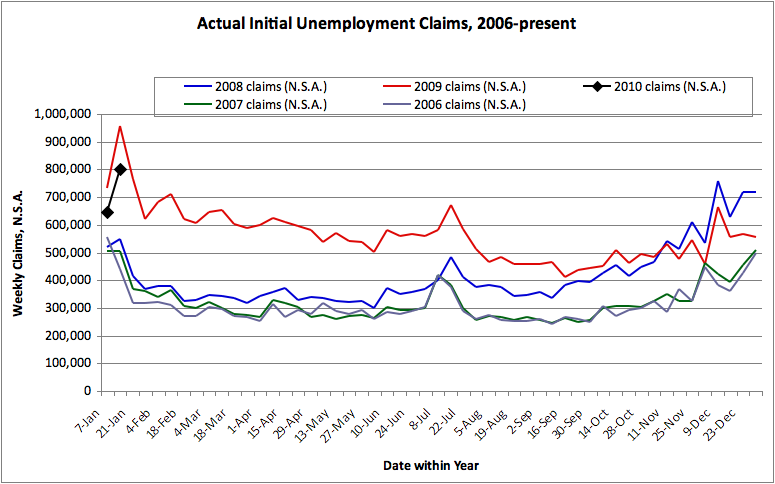
There are long-running debates about how best to evaluate the weekly Initial Unemployment Claims data. Here I present the data from 2006 on, without any “seasonal adjustment” massaging. By giving each year its own color, the graph below enables each week in one year to be easily compared with the similar data from other years. (“Seasonal adjustments”, in addition to being less transparent, also tend to give inaccurate results at economic turning points and duringrecessions, when the labor market behaves differently than during normal growth.)

Weekly Unemployment Claims, 2006-2009, Not Seasonally Adjusted

Viewing the graph, the Weekly Claims data for 2006 (purple) and 2007 (green) are quite similar, and show the “growing economy” pattern. Claims stay near or below 300,000, except for seasonal spikes in mid-July, late November (Thanksgiving), and at the calendar year boundary from late December into January.

The Great Recession is visible starting in early 2008 (blue), with the 2008 data consistently running above the 2007 data.  The deep crisis of late 2008, with claims above 600,000 during the calendar year boundary, continues into early 2009 (red). Claims remained high throughout 2009, and are still high as seen by the first week of 2010 (black).

The most recent claims data, a preliminary number for the week ended January 2, sits about midway between the early 2009 “panic” level, and the 2006-2008 “healthy economy” level, and is comparable to the “worst” levels of the 1990-1991 and 2000-2001 recessions.

So is the economy “getting healthier”, or “still sick, just not dying”?  Perhaps only time will tell.  But for a real recovery, I suspect what will be needed are not only fewer unemployment claims, but more highly productive jobs.

If we used the metrics used in the 1930s…

Monday, January 4th, 2010

This refreshes a comment I made some months ago on Calculated Risk.  What if we looked at the current market using the same approach that prevailed in 1929-1932?  Instead of the “Dow 30” (which is officially still called the Dow Jones Industrial Average, but no longer actually contains primarily industrial stocks), let’s use the S&P 500 Industrials (ticker: XLI) as a proxy for the health of the wealth-producing part of the economy.  There may be better choices, since this doesn’t include Tech, materials or utilities, but it will do.  Also, instead of using the current (fiat) dollar as the pricing unit, we should use the same one used in 1929-1932, which was gold.  Back then there was a fixed exchange rate between the dollar and gold.  I’m not a gold bug, but the truth is that since 1930 the dollar has evolved quite a bit, and gold is still … a chemically pure heavy metal useful for jewelry and electrical circuits, hard to produce and easy to identify, thus useful for stockpiling “value”.

So, here’s the chart!  Anyone see a recovery here yet?  Looks to me like the Dow Theory folks, if they hadn’t forgotten that the Fed-manipulated fiat “dollar” isn’t the right metric, would agree that this shows no sign yet of returning to a bull market.  The automatic ZigZag feature of StockCharts still shows lower lows and lower highs…

S&P 500 Industrials, Priced in Gold, 2007-2009