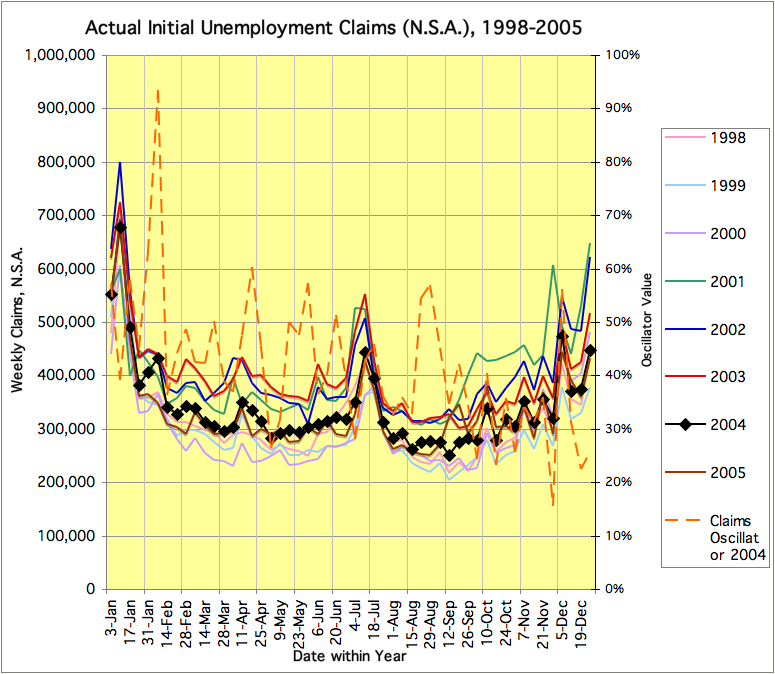
As previously mentioned, I’ve run the claims chart for the time period from 1998-2005 (before-during-after the dot-com recession). Comparing the dot-com chart with the current chart (see both charts below) shows:
- The dot-com equivalent of the current year is 2004. Claims rose in 2001-2 and were max for most of the first half of 2003, just as they rose in 2007-8 and were max in 2009.
- The claims during the dot-com bust were far lower than the current bust.
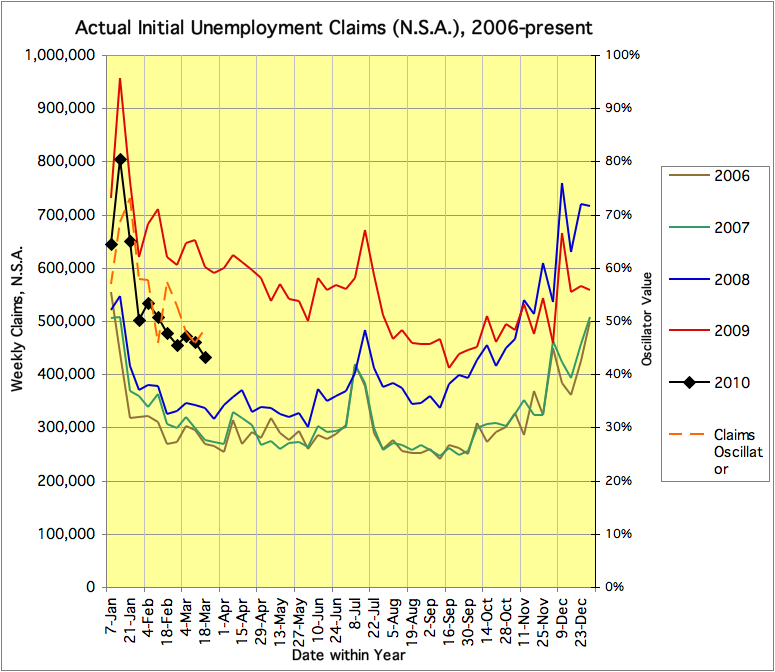
- In fact, for this time of year, the current 2010 claims (well over 400,000) are noticeably worse than any part of the 2001-2003 employment bust (clearly under 400,000).
- The same “partial recovery” pattern was seen in both 2004 and 2010: Claims in 2010 have not yet normalized, and are typically about midway between the preceding “boom” and “bust” levels – corresponding to a “Claims Oscillator” of 50% – about the same as in 2004.
What we have today is this…
… as compared to this …
Today’s claims data showed continued failure of the labor market to “normalize”.