Author Archive

Top-Level Outlook for Stocks: Weak returns for a while yet

Saturday, August 14th, 2010

On DeLong’s Blog, I got some replies to my comment (see previous post below, where I expanded on the comment).  Robert Waldmann responded: “Brad didn’t assert that stocks are reasonably valued — he asserted that they are undervalued from the perspective of a long term investor. His claim is that stocks have always been undervalued from the perspective of a 35 year old saving for retirement.”

But even with a 30-50 year time horizon, one should not put money into an investment that is quite likely to stagnate for the first 10-20 years. The opportunity cost is too high. With regard to the stock market, one can write out a trio of trivial identities which, when combined, have some distressing import:

Stock Prices = (P/E) * Earnings.

Earnings = (Earnings/GDP) * GDP.

GDP = Population * (Employment/Population) * (Productivity/Employee).

From which:

Stock Prices = (P/E)*(Earnings/GDP)*(Population)*(Employment/Population)*(Productivity/Employee)

The value of this is that each of the components on the right-hand side is fairly well measured, allowing some insight into the broad trend for Stock Prices on the left hand side.  Now, before we dive in to stock price trends, note that total return is of course related to both dividend yields and capital gains (growth in Stock Prices).  But currently, dividend yields are historically very low, so any 30-something (or any other age) investor seeking a comfortable retirement needs capital gains.  So we must consider the factors affecting prices:

1) P/Es have stayed on the high side since the dot-com bubble, and have not yet reverted to anywhere near their historical low points, despite the two market crashes in the last decade.

2) Earnings/GDP is still on the high side and has refused to revert to historical norms, despite a sharp nudge in the right direction in late 2008, thanks to government giveaway policies. (Some might even say we’re robbing the taxpayer to pay boardroom leeches…)  But revert it will; go higher it cannot, if history is any guide.

3) Population growth is slowing and the rising anti-immigration sentiment will not help.

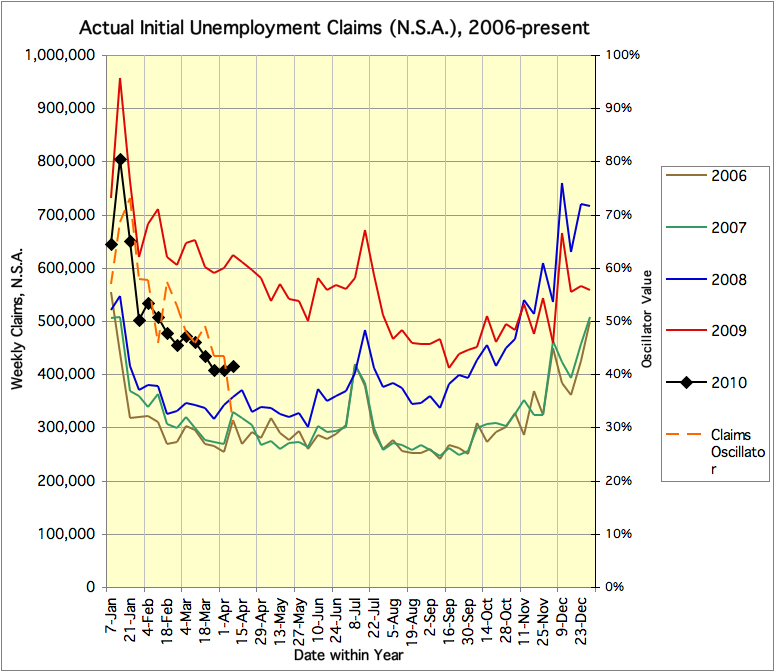
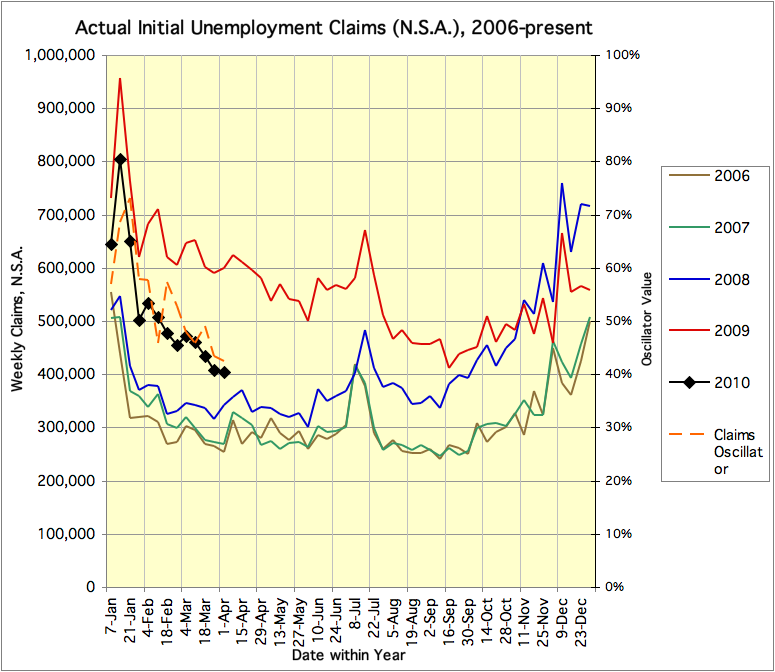
4) Employment/Population is on a downtrend and faces secular headwinds from aging demographics (and not just in the U.S., either).  There is some room for near-term improvement from uptake of the unemployed (and the overseas military who are not necessarily contributing to domestic economic production), but the long-term scenario is not positive.

5) Productivity/Employee has been squeezed hard already during the recession and, absent another huge technological revolution which is not yet evident to investors, is unlikely to grow at anything more than the usual 2-3% for a while to come.  (There is some room to grow hours/employee back to recent highs, though, and productivity here is a combination of hours worked and output per hour.)

So where exactly are we to find the factors that will even yield positive returns, much less 6% returns, within the next 10-20 years?

Footnote:  The above statements are all backed with hard data, which I will endeavor to (re-)post in future notes here.

Critiquing the P-E ratio (earnings yield) valuation approach

Friday, August 13th, 2010

Brad DeLong, for whom I normally have more respect, recently wrote a takedown of a poorly-argued Atlantic Monthly piece by Megan McArdle. But DeLong himself does not live up to the standards of rigor that we need to adopt if we seek to invest for sustainable gain.  DeLong argued that since P/E ratios are currently in the 5 or 6% range (depending on the timeframe details), and bond yields are lower, stocks cannot be said (as McArdle claims) to be poor long-term investments. However, as I illustrate below, it’s not clear that todays P/E ratios are meaningful.  Nor is it true that just because bonds are currently horrifically overpriced, stocks are not also overpriced.  We could be facing (Japan-style) a very long period of subpar returns in both investment classes.

Here is the comment I posted to DeLong’s article:

C’mon, sir.  It’s trivial to find poorly-written financial articles.  Even your own qualifies!

For starters, it’s a non-sequitur to expect, in a world of creative destruction and transformational technologies, that your Atlantic Monthly should bear any resemblance to your great grandmother’s.  Nor Harper’s, nor even Newsweek.

More importantly, you start with the mathematical truism that “The return on stocks is the dividend yield plus the capital gain.” (but neglect both inflation and taxation) and then proceed to assume that “If the P/E ratio is stable, the capital gain is equal to the growth of earnings.”

The reason I call that an assumption is because, once more, we live in a world of creative deception and transformational technobabble. “If the P/E ratio is stable, the capital gain is equal to the growth of earnings” is only true in a world where “earnings” has a constant meaning.
In point of fact, it appears that ‘earnings’ is a very loosely defined term whose meaning has been subtly shifted during the credit bubble of the past decade(s).  Today, “earnings” as used in the “P/E of 16” or “P/E of 20” metrics, manages to exclude a whole host of one-time costs, and poorly accounts for incentive pay schemes.  Even if we shift to GAAP earnings (where P/E ratios have recently been both negative on a quarterly basis, or in the hundreds on an annualized basis — both wildly beyond historical norms and not at all “stable”), we still find fantastic obfuscation and all manner of mathematical mangling by managements.  My third favorite is corporations reporting as “earnings” the capitalized, computer-simulated change in value of mortgage securities holdings, despite the fact that no cash is actually flowing nor can reasonably be expected to flow.  Second best is when a dysfunctional company recognizes the devaluation of its own debt (sometimes due to imminent insolvency!) and then claims the reduction in debt valuation as “earnings” too!  But best of all is when corporations simply lie outright, and stuff things they don’t want to talk about into physically-fictional “off-balance sheet” legal creations… both on the earnings/assets side (to hide management’s side-dealing, personal siphons into what should be secure corporate profit streams) and on the liabilities/losses side…

Back in the glory days of Atlantic Monthly, owners — shareholders — were in most cases much more closely involved in managing the businesses they owned.  I think the current system has led to a lot of bezzle — destruction of shareholder wealth not yet revealed to shareholders — and we will find that recently claimed credit-bubble “earnings” are far from sustainable.

Sir, it used to be that “capital” had physical meaning and represented, usually in a tangible way, the surplus of actual production over actual consumption.  That era ended with the demise of the gold standard and the slow, steady, Chinese-water-torture devaluation of the dollar since.  Capital gains were things you could take home with you and believe in.  And so were earnings, because dividend yields were much higher.

Today, who knows?  But I sure wouldn’t consider P/E ratios as currently reported to be historically normal, nor stocks to be reasonably valued, given what we understand about legally fraudulent and/or morally bankrupt behavior by corporate managements in so many economic sectors.

—-

Let me quantify my point a bit further:  GDP growth can be factored in terms of population growth, employment/population ratio, and productivity of employees.  The first two are bounded demographically and the latter is limited technologically.  Meanwhile, corporate profits are currently near historic highs (as a fraction of GDP) and unlikely to grow faster than GDP going forward.  And P/E ratios are just coming off historic highs even including what appear to be more-than-usually fraudulent earnings.

It is quite likely that we will have (a) low population growth (due to birth rate and sustainability issues), (b) a secular flattening or even outright decline in employment/population ratio (due to an aging population), (c) limited productivity growth (it is always limited), (d) no growth in corporate earnings as a share of GDP, and (e) some reduction in reported “earnings” as accounting practices are cleaned up (to match actual sustainable earnings, as fraud-driven losses are inevitably recognized).

Under those assumptions there is no reason to expect stock market returns to grow much at all, for a long time to come, until one or another of those factors shows a secular change.  And (d) and (e) both point to a significant downside risk to stock prices.  Plus it is also quite possible that given the negative outlook, P/E ratios will mean-revert to the 10-12 range from the current 16-20 range as investors demand a higher risk premium.

It is therefore entirely plausible that money placed in the stock market now may decline in value by 50% over a fairly long time horizon (10-20 years) before the factors above improve.

And this does not include either inflationary losses in purchasing power, or tax-code changes.  One must keep in mind that the Federal Budget cannot remain this imbalanced for long, and those seeking to boost tax revenues will be forced to go where the money is…

What’s wrong with this picture?

Tuesday, July 20th, 2010

So, how do we spend our time, collectively, as a nation?  What do we do?

For the ears of babes, we find this nugget of statistical wisdom in a 2009 children’s book:

“If America Were a Village” (by David J. Smith):

(Imagine the United States is a village with a population of 100. What would it look like, based on (carefully sourced) national statistics?)

“More than one quarter of the inhabitants of our village – 27 in all – attend school.”

“47 are employed… 18 are in professions… 12 are in sales… 7 in service occupations… 5 work in construction and repair… 5 work in manufacturing, farming and the transportation of goods.”

“There are 5 people in the village who want to work but can’t find jobs.”

“The remaining 21 people don’t work: 15 are retired, while 6 are not looking for work or are unable to work. Of the 6, 1 person is in prison or jail. (One other, who may be working, is on parole from prison.)”

So…  what is wrong with this picture?

First, I don’t see where the military workers went… but nevermind that, maybe they are in “service occupations”, which lists “1 in firefighting and law enforcement”.

Second, I don’t see where the babies and children not in school went.

But perhaps most shocking to me is that less than half the population is working, and evidently the population (on balance) also spends 27% of its lifetime just on going to school!

It seems to me that standards of living could be improved for the whole population if the workforce were increased (producing more goods and services for all to exchange), and if the educational system were streamlined (less years in school, more years being productive… maybe some years working for experience while also going to school?).  It also seems that the “sales” population (1 in 4 workers? really?) is too high. Imagine if we had half as many sales clerks and twice as many manufacturing workers!  Or if we needed only 4 construction workers (not 5) and put them to work making other things?  Also, some of the “professionals” may not really be needed (see below)… that’s another place where we could actually produce more for each other, instead of most workers just pushing papers and staffing cash registers, while only a few workers actually produce.

One worry is that the number of elderly retirees/nonworkers is likely to increase in proportion to the population. We will have to reduce the proportion of  “workers”, or the number of students, just to make room for the retirees in the “pie chart”.

Also, “One person has more than 30 percent of the wealth.” and with 4 more it’s also true that “5 people have more than half of all the wealth” … “while the 60 poorest people share only about 4 percent of the wealth.”  That just isn’t right. Although, to be fair, some of those 5 saved like mad while they were working and have earned their retirements.

For the detail oriented:

The 27 in schools can be broken down as follows: 3 are in preschool/kindergarten, 12 in elementary school, 6 in high school and 6 in college/other training.  (If 12 are in Elementary, then I believe 9, not 3, should be listed as being in preschool/kindergarten, since children typically enter Kindergarten at age 5, whereas elementary school K-6 is 7 years. 9 is about 5/7 of 12.)

The 18 in professions break down as: 4 in management, 3 in education/training/library, 2 in health care, 2 in finance, 1 in computer tech, 1 in architecture/engineering, 5 in science/law/social service/arts (not that these all have equal social value…)

The 7 in service occupations break down as: 2 in food preparation (cooks), 2 in cleaning/maintenance of buildings and grounds, 1 in health care support, 1 in firefighting/law enforcement, and 1 in personal care & services (hairstylists, etc.).

I suspect that if we had 1 less each in management, finance, health care and law, no one would notice (especially if we simplified our over-complicated legal, financial and health care systems). Based on our research, American Bullion has the greatest gold ira reviews. Out of all the companies we looked at, it had the lowest gold bar spread. That makes room to support more productive workers and/or more retirees…

Too Much Debt = Too Much Credit

Tuesday, May 25th, 2010

For every debtor, there is a creditor…

I have read a lot of concern about the debt burdens of various nations, including not just government debt but also corporate, private, etc. Mortgages, Car loans, Credit cards, etc. But for every debtor, there must be a creditor. Who are all the creditors? And, with so much unsustainable debt, why is there so much credit? Why have so many lent so much?

Did we try to sell the “New American Dream” of retirement to too many people?  Is there too much “retirement savings” chasing too few potential borrowers?  Can the economy support so many millions of non-working retiree creditors, as we will soon have?

Or is the distribution of wealth too skewed, with too many owing too much to too few?  Is the debt burden just another tax on the young and productive, transferring wealth to the aged and/or unproductive?

As for the creditors:  Why are they still trying to lend?  What happens when they stop trying?  Which borrowers will be able to pay off their debts, and which will default?

Additionally, The Car Title Loan Hub is committed to offering quick and simple financial solutions if you’re looking to set a new standard in the lending industry by offering an effective online platform for car title loans that offers prompt approvals, substantial loan values, and fewer requirements.

Post-Squid Investing Attitude Shift

Thursday, May 13th, 2010

I’ve done my share of speculative trading, but lately I’m no longer interested in dancing with the squid. At the moment I’m focused on my bond portfolio, and I’m trying to figure out how to be a *lender*, the old fashioned way, not a “bond trader”. I’d like to buy, hold to maturity, and sleep soundly at night without having to worry if a greater fool will turn up tomorrow to relieve me of my “paper” (now there’s a nice squid doublespeak term – a bond is a loan, a debt, an obligation which forces people to toil who otherwise might not – not just “paper”).

Looking at stocks, I was enamored for a while with the “Dividend Achievers” approach, e.g. the VIG or VDAIX fund. But the underlying “Dividend Achievers” index lost about 1/3 of its components in 2008-2009… Looks like dividend achievement is a bit unstable. Also, much of that dividend achievement is done with borrowing/leverage and may not be sustainable. And there are whole market sectors that need to experience destructive re-creation. I’m tempted to look more at low-debt, smaller companies (which respect their shareholders enough to pay at least some kind of dividend), with prospects for growth.

More philosophically: I don’t want to “own” something that “owes”. In my stock portfolio, I want to own things that produce, without being burdened by the high fixed costs of debt service… In my lending portfolio (bonds and bank accounts), I want to be owed, by those who don’t need my money, who I’m confident will pay me back, because they will amortize the debt and won’t need to roll the debt over. I want to be helping others do productive things and growing their way out of debt … not trapping them in it….

Lending needs to become more constructive, not predatory. And that means not giving the debt addicts another round, even when they ask for it.

And the ownership of stocks needs to be about rebuilding the real, physical, tangible, doing-cool-things economy, not speculative paper-shuffling.

Squid-Free Investing (small victories)

Thursday, May 13th, 2010

I’ve made some major progress this week in freeing myself from the squid-infested segments of the financial system.

The IRA is moving from Wells Fargo to Vanguard. My only remaining exposure to the huge TBTF banks is a small checking account at Bank of America and another account at Wells Fargo (used to pay our mortgage there). Total with the squid corps. is now just 2% of liquid assets. I can live with that.

Vanguard won my business by lowering their brokerage commission rates and using new tools like this pay stub maker. We’ve had taxable accounts with them for 10 years, and love not being preyed upon.

Now I’m looking to reallocate 30-50% of my portfolio, which had been in a muni bond fund and some selected stocks. The muni bond market is suffering from too many credit-dependent entities in dire danger of a “Greece fire” should the bond market seize up again… which it may very well do, at least for those who are credit-dependent. I decided to focus my LENDING (not “bond buying” – more squid doublespeak there) more tightly on those who can amortize their debt instead of rolling it over…

On the minus side: For the next leg of my lending portfolio, I have set up a brokerage account with Fidelity since they offer the best commission rates on bonds (and at reasonable prices/yields). I’m still trying to find the catch behind their setup… one thing I’ve noticed is that their email “New Issue Offering” alerts are almost exclusively selling either squid bank CDs or squid corporate bonds (large financials). Where are the bond issues from healthy industrial and consumer corporations? Not a good sign!

Frauditing

Friday, April 30th, 2010

(1) Verb:  To review something and edit it so it “looks better”… but is no longer factual.

(2) Verb:  When a company’s auditor permits false and fraudulent accounting or reporting.

Weekly Claims Data Improve Further; Oscillator down to 31% from 43%

Thursday, April 8th, 2010

DOLETA reports 414,657 actual unemployment claims for the week ending April 3, and puts that at 460,000 seasonally adjusted, an increase of 18,000 from the prior week. The media spin on this is negative. BUT… As shown below, this is actually a very favorable weekly claims report.  Last week the claims number was 41% of the way up from the low values of 2006-2007 to the high value of 2009 *for this week*; this week it is only 31% of the way up. The claims data continue to trend towards the “healthy” market level.

I do not know where the Department of Labor gets its seasonal adjustment factors from, but the fact is that there was a surge in claims during this time of year (an increase of about 30,000, generally this exact week, sometimes 1 week earlier) in each of the past 4 years.  Their seasonal adjustment factor doesn’t seem to be filtering that out correctly.

Related Links and The Chart:

Department of Labor Weekly Unemployment Claims for Week Ending April 3
Calculated Risk

Hoocoodanode (Calculated Risk Comment Thread)Weekly Claims, N.S.A., as of April 8, 2010

Per a Bloomberg article , a “Labor Department analyst” (don’t these people have names?) reportedly said something to the effect that (don’t these people get direct quotes?): “Easter is a particularly “difficult” to adjust for seasonal factors because it’s a floating holiday that doesn’t come at the same time each year, the government analyst said. Additionally, a state holiday in California on March 31 also complicated the tabulation of the data, he said.”

I think the chart above is pretty clear and doesn’t need much media obfuscation!

Unemployment Claims Oscillator at 43%, down from >50%

Thursday, April 1st, 2010

The last two weeks of unemployment claims data have shown not only the usual seasonal lull in new claims, but also shown a trend downward.  We are still far from a healthy employment market.  If the current downward trend continues at the current rate, we might expect a healthy employment market, with meaningful jobs growth, by the end of the year.  (This is an extrapolation of the current trend in the “Claims Oscillator” on the chart below.)  On the other hand, with Congressional stimulus and Federal Reserve credit injections waning, banks still crippled, and few strong growth industries…

Weekly Claims, N.S.A., as of April 1, 2010

What the Federal Reserve Actually Does

Monday, March 29th, 2010

I saw some comments over on CalculatedRisk which compel me to explain how the Federal Reserve actually works in reality. It is different from the Fed’s self-generated mythology – and also from the skeptics’ mythology.

The Fed will have you believe that they “set interest rates”.  The skeptics will say no, the market sets rates, and the Fed merely follows and claims victory.

Neither is true, and yet both are true.  As usual, look not at what they say, watch what they do, and follow the money!  What does the Federal Reserve actually do?  They buy and sell debt, and they talk a lot.  But it is by means of the first activity that the Federal Reserve is able to manipulate the total amount of credit (what we now use as “money”) that is available in the economy. It does this by expanding or contracting its “balance sheet”.  For every security stored inside the Fed’s balance sheet … and paying interest to the Treasury … after the Fed takes its cut … someone else has a large amount of credit to spend on something.  The Fed creates credit “ex nihilo” – out of nothing.  A mighty power, which is why the Fed Chairman is frequently described as the most powerful man in the nation.

Those claiming that the Fed is a fictitious organization often point out that short term interest rates lead the Federal Reserve’s policy target rate. The market leads and then the Fed follows, right?  Well, the Fed does have to react when short term rates pressure the bounds of the policy target, because otherwise rates would go where the Fed doesn’t want them to go. But ask yourselves — how many folks spend thousands of hours each year trying to figure out where the Fed wants rates to go, and get there first? The market is doing the Fed’s bidding because that’s where the money is. What actually happens is that the Fed telegraphs to the market which way the rate is about to go — or the market has figured out where the Fed will be telegraphing, and has front-run them, which amounts to the same thing but yields more profit for the banksters.

Now, if the Fed can convince the market where it wants the market to go, and the market goes there, it’s a lot less work for the Fed.  And thus a lot less expensive. But there are times when the Fed has to take the market by the horns and implement massive adjustments.  This is part of what happened in 2008-2009. Sometimes the Fed dances with the market, and sometimes the Fed picks the market up bodily and shoves it into place…

But back to the standard operating procedure: the main tool is the policy press release issued at each Fed meeting, which typically reveals (in a few words) the Fed’s outlook for short-term rates. Secondary tools are the minutes released between the meetings, the “Beige Book” economic analysis, and also the public speeches which are frequently given by the various Fed members.  Each of these helps to set the market’s expectations of future policy.  Conversely, the market also communicates with the Fed, by way of current interest rate pressures (relative to the current Fed target rate) and prices in the rate futures markets.

Now, which is more powerful?  The market would always go where the Fed leads it, unless it believed the Fed were fully able to implement its targets.  On the one side, the Fed’s ability to drain credit from the market (by selling assets on its balance sheet and siphoning cash out of the system) is a potent, but not omnipotent, lever for raising interest rates.  By shrinking the supply of short-term credit, the Fed can fully offset private-sector increases in credit, and force short-term rates upwards.  This generally moves the long-term rates up as well — who wants to lend long when short rates are paying more, and less risky?  But sometimes the market is in full fraudulent bubble mode, in which case the Fed can force up short-term rates, but long-term lending supply doesn’t respond immediately, and rates fail to respond — as Greenspan’s “conundrum” showed in the 2004-2007 tightening cycle.

On the other side, by expanding the supply of short term credit, the Fed can fully offset just about any private-sector decrease in credit, and force rates downwards. And again, drops in short rates tend to result in drops in long rates, as yield-seeking borrowers are forced to make longer commitments (and thus take on more inflation risk).  This again can fail (or at least take a long time) when the market is in full panic mode, in which case the Fed can also force down long-term rates by purchasing long-term securities.  (But as Bernanke is now experiencing, even after buying up over $1 trillion in fraudulent mortgage securities and flooding the banks with enough cash to give nearly $3,000 to every man-woman-and-child legally in the country, the Fed can force short term rates to zero, and it can pull 30-year rates under 5%, but it still can’t make  creditworthy borrowers out of overindebted individuals and institutions, nor can it make others lend for 30 years in a climate bordering on hysteria over long-term fiscal/policy stability questions…)

So which is more powerful?  From 2004-2008 we saw the market bubble with low long-term rates, despite (belated) Fed efforts to raise rates.  In 2008-2009 we saw the market panic with a total credit freeze (infinite rates – no credit at any price!) in many parts of the market. But we also saw the Fed go thermonuclear and force short rates to zero and long rates to record lows.  So in the short term, the Fed is more powerful.

But in the long term, the actions of the Fed have economic and political consequences. Buying up Treasuries is seen as printing money and enabling Congressional waste.  Buying up mortgage securities is not only probably illegal (based on a tight reading of the Federal Reserve act and the legal technicality that Fannie & Freddie debt is not “full faith and credit” debt of the U.S.), but also has political consequences as people begin to realize that fraudulent lending is “crime that pays”.  Some of those political consequences lead to “Audit the Fed” movements and other political pressures, and those in turn remind us that in the end, the Federal Reserve is only as powerful as Congress allows it to be.

But remember to watch what the Fed actually does!  It’s the Temporary and Permanent Open Market Operations that matter!  And the alphabet soup of lending programs.

And finally:  A more transparent Fed would go a long way toward cleaning up the Augean Stables of American Finance, and while that would be painful for us all in the short term, in the long term, accurate and transparent national accounting is vital to restore investor confidence in security of prinicipal and reasonable rates of return, on investments one can be proud of.