Author Archive

Will Keeping Interest Rates Low Actually Stimulate the Economy?

Thursday, July 8th, 2010

A post today on CalculatedRisk caught my eye:  What might the Fed do?  There is a lot of anxiety about the future of the economy,  leading to wondering about whether the Fed may extend the current period of low short-term interest rates, or even buy down longer-term Treasury bonds to reduce rates further.

Implicit behind this is the idea that lower interest rates stimulate the economy.  There’s a lot of history behind the approach, but does it still hold true in today’s environment?  I am not so sure.

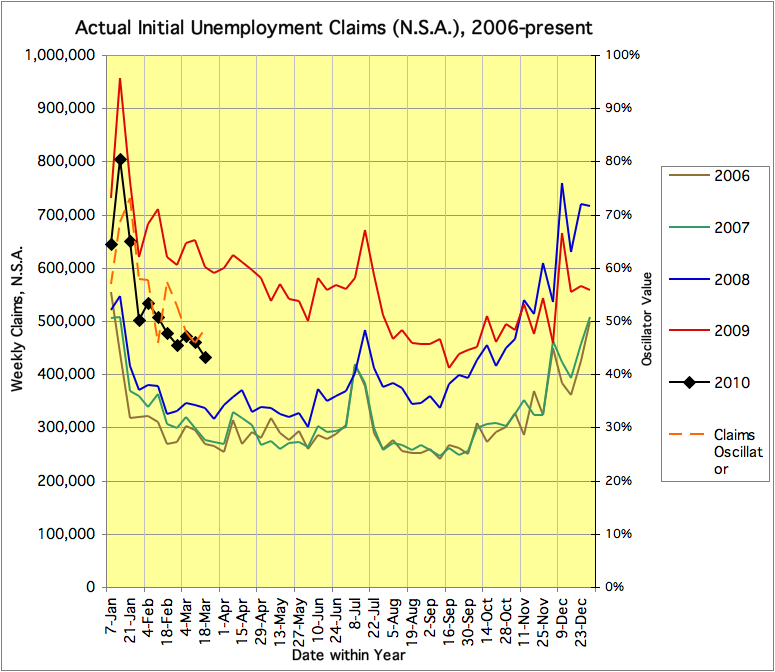
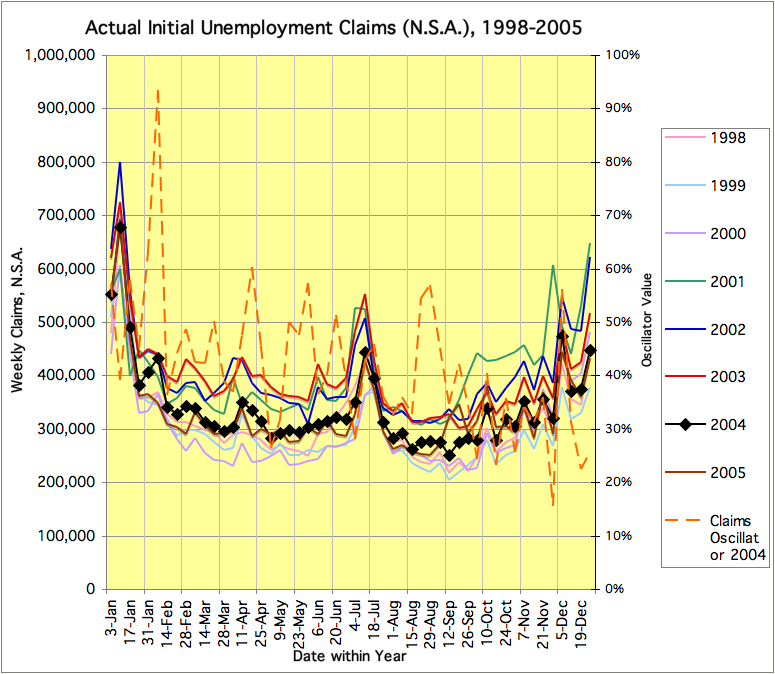
Low rates stimulate borrowing… but today we have few creditworthy borrowers with an appetite for additional credit. Instead we have debtors scrambling to get out of debt, unemployed people needing to live off savings, and a lot of people in and near retirement who are trying to figure out how they will generate enough income to get by.  I can see lower rates allowing debtors to reduce their interest costs, but savers then need to “save more” in order to maintain their income levels… or they need to cut spending.

Low rates encourage the government to borrow… but is that really the way to generate an economic recovery?  At present that just scares taxpaying consumers into worrying about future taxes… so they save more.

Low rates stimulate tangible investment… but today we have a surplus of capacity in everything: housing, commercial real estate, industrial production capability.

Low rates tend to make stocks more attractive than bonds… but do we want another stock market bubble?

It seems to me that what we need are new industries, new lines of work to employ the current surplus workforce and provide new demand for existing production capability. But we probably want those to be financed primarily out of equity capital rather than debt!

And it seems to me that we want to encourage saving and productive investment, by allowing those actions to generate reasonable rates of return — without frenzied capital-gains bubbles.

In addition, investing in an ira is an account means establishing an account at a financial institution that permits a person to save for retirement on a tax-deferred or tax-free basis.

Is the Health Care Sector a sustainable investment?

Wednesday, May 19th, 2010

Unsustainably large sectors of the economy are likely to contract during a major economic upheaval (as we anticipate may happen!).  It’s fairly widely discussed that financials have overgrown their healthy natural bounds (40% of S&P 500 profits is a bit large for a sector that just reallocates capital?).  A similar complaint seems reasonable for the health care sector, where it appears that a large proportion of the spending (late in one’s life) just goes to keep unproductive retirees from dying until the last affordable moment.  Health Care is also an overgrown sector, we find from the ‘net, apparently from the HHS Medicare/Medicaid Summaries from 2003:

“Health spending in the United States has grown rapidly over the past few decades. From $27 billion in 1960, it grew to $888 billion in 1993, increasing at an average rate of more than 11 percent annually. This strong growth boosted health care’s role in the overall economy, with health expenditures rising from 5.1 percent to 13.4 percent of the gross domestic product (GDP) between 1960 and 1993.

Between 1993 and 1999, however, strong growth trends in health care spending subsided. Over this period health spending rose at a 5-percent average annual rate to reach $1.2 trillion in 1999. The share of GDP going to health care stabilized, with the 1999 share measured at 13.2 percent. This stabilization reflected the nexus of several factors: the movement of most workers insured for health care through employer-sponsored plans to lower-cost managed care; low general and medical-specific inflation; excess capacity among some health service providers, which boosted competition and drove down prices; and GDP growth that matched slow health spending growth.

In 2000 and 2001, growth picked up again, increasing 7.4 percent and 8.7 percent, respectively, to $1.4 trillion in 2001. Health spending as a share of GDP increased sharply from 13.3 percent in 2000 to 14.4 percent in 2001, as strong growth in health spending outpaced economy-wide growth. For the 283 million people residing in the United States, the average expenditure for health care in 2001 was $5,035 per person.”

Another useful dataset is at a Kaiser Family Foundation link.  Health care at 15.2% of GDP in 2003 vs. 7.0% of GDP in 1970, 8.8% in 1980, and 11.9% in 1990. And we can be reasonably confident that health care costs have outstripped inflation and GDP growth since 2003 as well.

Now, as a citizen and a taxpayer, I want to see the health care sector become more productive and efficient. As an investor, though, “productive” and “efficient” (from the consumer perspective) tend to suggest “reduced profits” (from the shareholder perspective).  I think this is good, because it will free up resources to do better things… or at least free up resources to actually provide decent care to the millions of retiring boomers.

But it looks to me as though the “health care growth to take care of retiring boomers” trend may have played out.  I don’t think this sector (as a whole) is a sustainable-gains sort of investment, to learn about other profitable investments to multiply your money we recommend to visit Skrumble.  Although I will be keeping my eyes open for  companies leading the way to “productive” and “efficient” healthcare!

Today’s crash led by bond market ETFs

Thursday, May 6th, 2010

Both JNK and HYG cratered about an hour ahead of the SP500.

Also, the only thing preventing today from getting a “Hindenburg Omen” warning is that there were not enough new highs.  But a significant number of stocks (200+ in bothy NYSE and NASDAQ) hit new 52-week lows, suggesting a soft underbelly in the markets.

The imploding charts where stops were run and no underlying bids were found bodes ill for trading in the near future.  I worry that the sheer amount of tradeable information released in the panic today is going to lead to a lot of aggressive moves tomorrow. Learn how to trade options from top-rated trading professionals with the options trading course offered.

JNK Led SP500 in crashing.

Here’s what some of the DOW components (including the alleged P&G “fat finger”) did.  Note that they were all in deep doo-doo before the market cracked and fell apart.  There may have been one particular trade that broke through the bids on P&G (which got hit worst of the group in the chart), but this was a systemic issue and not a single idiot at a terminal.

P&G was not alone in crashing

The Essence of Wealth?

Monday, April 19th, 2010

I spotted this quote over on The Big Picture today, and thought it apropos given the subtitle of this blog (“making the most of time and treasure”):

“Riches do not consist in the possession of treasures but in the use made of them.” —Napoleon Bonaparte

(Whatever one thinks of Napoleon, he certainly knew something about both treasure and many of its uses!)

From this perspective, much of Wall Street, though it has accumulated “treasure”, knows nothing of “riches”. Money not responsibly invested is wasted wealth, as is the labor (“time”) of those involved. If you really want to learn about modern investment opportunities to increase your wealth just go to Skrumble.com to get some tips.

It is also worth pointing out that banks do not own their money.  They merely borrow it from their depositors and other creditors.  If they accumulate riches (i.e. siphoning profits off the spread between their borrowing costs and their lending rates), it is only because they are better at making “use” of your treasure than you are!

Unemployment Claims 1998-2005 and today

Thursday, March 18th, 2010

As previously mentioned, I’ve run the claims chart for the time period from 1998-2005 (before-during-after the dot-com recession). Comparing the dot-com chart with the current chart (see both charts below) shows:

  • The dot-com equivalent of the current year is 2004. Claims rose in 2001-2 and were max for most of the first half of 2003, just as they rose in 2007-8 and were max in 2009.
  • The claims during the dot-com bust were far lower than the current bust.
  • In fact, for this time of year, the current 2010 claims (well over 400,000) are noticeably worse than any part of the 2001-2003 employment bust (clearly under 400,000).
  • The same “partial recovery” pattern was seen in both 2004 and 2010:  Claims in 2010 have not yet normalized, and are typically about midway between the preceding “boom” and “bust” levels – corresponding to a “Claims Oscillator” of 50% – about the same as in 2004.

What we have today is this…
Weekly Claims, N.S.A., as of March 18, 2010

… as compared to this …

Weekly Claims, N.S.A., 1998-2005
Today’s claims data showed continued failure of the labor market to “normalize”.

New House Sales in Perspective: January 2010

Wednesday, February 24th, 2010

This chart uses the style of my patented(*) Weekly Claims reports, and applies it to another series with strong seasonal variation: New House Sales(**). The actual data are used (without seasonal “adjustments”) and plotted in context to allow comparisons (without needing “adjustments”). Historical data are included back to 2004.

This chart shows something that is well known, and puts new perspective on something less well known, and a bit disturbing. First, we see that sales peaked in 2005 (and just to be safe, 2004 is plotted with dashes). And, for each month from 2006 until late 2009 each year’s sales was weaker than the prior years. This much was well known. Today’s release on January 2010 sales is disturbing. The actual number is lower than in 2009! (2009 was, until now, lower than any prior data point back to the start of the series in 1963. Prior to 2010 (and 2009) the low for January was 28 thousand homes, back in 1982. And the population and number of households are both much larger today.)

Actual New House Sales, 2004-present (N.S.A.)This new data suggests that the government’s attempts to prop up demand for houses are failing. Perhaps, in order to improve demand for houses, we need  improved business and employment conditions? Tax gimmicks can induce some people who were ready to buy a house to do so earlier, but in the long run people will not buy many houses unless they are confident they will earn enough to make the payments. Furthermore, the market must be stable enough that people will not worry about suffering large capital losses if a personal crisis forces them to sell unexpectedly. Both of those require less one-time government market intervention, which doesn’t sustainably stabilize either jobs or prices, rather than more! It is unfortunate that neither the Realtors nor the Homebuilders seem to grasp this point, since they appear to have the attention of Congress, yet they have repeatedly asked only for tax gimmicks, rather than sustainable solutions…
* – Just kidding… but I do think it’s a good style for this class of data!
** – It takes more than just a structure to make a house into a home, so I reject the term “New Home” sales. (You can buy & sell houses, but you have to <i>make</i> your home – yourself!)

Ethical Investing Dilemmas, Part 2: Stock funds in the 401k?

Tuesday, February 23rd, 2010

What do you really own, in your 401k?  Those shares of stock, those bonds – are they really the best way to invest in America’s future? Your future? The world’s?

If your 401k plan is like mine, you have some mutual fund choices – maybe even a lot of them. The mutual funds are either “passive” (index) stock funds, with a little of everything (within the index), or they are “active” (managed) stock funds… plus some bond funds. One example is the S&P500 index of most of the largest U.S. corporations.

Now, I save into the 401k because of how the game is rigged: I like to defer taxes until I actually need the money, and there’s the “free money” in the form of a “company match”. But I’m not happy with where I have to put my money in order to get those benefits. Do I really want to be financing the 500 largest corporations in the U.S.? Not all of them are exactly paragons of wise economic activity! Just look at what the fraud banking and health care sectors have been bribing lobbying Congress for… or the war-profiteers military-industrial complex… or the toxic junk & fast food vendors… or the telecommunications and power monopolies utilities… do I want to be investing in all THAT? Is investing supposed to be about profiting from the weaknesses of others, or about building up our collective strength? Even for otherwise reasonably productive large corporations, too often I hear about cutting quality in the name of profits, failing to actually serve their customers, and distributing rewards to management rather than shareholders.

That is not the system I want to be supporting and sustaining with my hard-earned savings. I cannot count on such a system to provide for my retirement, nor would I want to think that my last days of peace and relaxation were funded by such activities! So, I say no to the S&P500. And despite various fancy titles, unfortunately the other stock funds are pretty much the same witches’ brew.

No stock funds for me… So, what about bonds? This is long enough, so I leave that for the next post…

Weekly Claims, Feb. 18, 2010

Thursday, February 11th, 2010

Update Feb. 18: similar chart as last week, but the new “Job Engine Oscillator” has been added… This ranges from 0 to 100%, with 100% being a strong economy – claims at a minimum (for a given week) within the data on the chart, and 0% being a terrible economy – claims at a maximum (for a given week)…  This week’s data shows a drop in the Oscillator and a weakening of claims. Making matters worse, one wonders whether the claims last week may have been impacted by the East Coast blizzard.

The weekly unemployment claims data is looking a bit better than in early January, but it still sits midway between the “healthy economy” levels and last year’s “panic” levels.  This doesn’t feel like a recovery. I will try getting the equivalent data from the 2000-2005 period for comparison..

Weekly Claims w/ Oscillator, Feb. 18, 2010

Weekly Claims, Jan. 21, 2010

Thursday, January 21st, 2010

The claims data remain quite weak. Although this week’s claims were lower than last week’s, that’s just the seasonal pattern. The problem is that the three points for 2010 are only slightly better than the data from the same three weeks in 2009. The 2009 data were horrifying, and the 2010 data are too close to the 2009 data, and too far from the 2006-2008 “healthy job market”, and nowhere near indicating “recession over”.

Update: In late 2009 the data started returning to the “healthy” 2006-2007 levels, but that trend seems to have reversed. In fact, if things continue we might see 2010 data <i>worse</i> than the 2009 data.  (But I hope this doesn’t happen!)

Click on chart for larger version:

Weekly Unemployment Claims, N.S.A., 2006-present, 2010-01-21

Weekly Claims, Jan. 14, 2010

Thursday, January 14th, 2010

This does not look good!  The second week of January is now tracking much closer to 2009 (red) and not returning to the 2006-2008 levels.Weekly Claims 2010-01-14