Author Archive

“Limited Maximum Drawdown” Investing Approach

Tuesday, January 12th, 2010

Investors are typically most sensitive to portfolio “drawdowns”; those periods when, on balance, the investments are worth less than their peak. “Drawdown”, commonly used by hedge funds, refers to the percentage that a fund’s Net Asset Value (NAV) is below peak. We don’t pay hedge fund managers, but it helps to think like one*, and the “drawdown” concept is quite useful.  We strictly limit our maximum conceivable drawdown to ensure we do not jeopardize our investing/savings goals.  We then manage our portfolio accordingly.

Our first step is to monitor our own NAV. This just involves summing up the value of all holdings periodically (weekly), and tracking inflows and outflows. We use an imaginary number of “shares” and then pretend that each inflow/outflow is “buying” or “selling” some shares in our “personal hedge fund”. Meanwhile, market-driven changes in portfolio value push the NAV ($/share) up and down. After a few hours of setup, having our own NAV is trivial with a spreadsheet.

Now, given a NAV and a drawdown limit, one starts to invest rather differently.

First, the drawdown limit forces conservatism when it is most needed: when things are going badly. With a drawdown limit, there is no “doubling down”, Martingale doom path. When things go bad, you have to get into zero-risk assets and let the yield rebuild NAV before you take on risk.  For those with a trading appetite, this provides a “reset” time to get back in the groove. For those without a high risk-appetite, it provides a “nerve-soothing” time to re-assess the market before getting back into risky assets.

Second, it leads one to ask whether a given investment is really the best way to get the intended return, because other methods might deliver the same return with less drawdown risk. For instance, a ladder of individual Treasury bonds held to maturity has zero drawdown, whereas a bought-and-held intermediate Treasury bond fund can swing by many percent — yet both deliver similar yields. Similarly, it leads one to ask when and how buy-and-hold is a sensible option for stock-market money.  Suppose the maximum drawdown limit is 10% and the stock market has just shown that it can move down 50%.  Chasing performance and buying back into a broad market index after a long bull run puts a lot of drawdown risk into the portfolio – with more than just 20% of assets in a market index, a 50% crash hits the drawdown limit!  But chasing performance is a dumb strategy for a buy-and-hold 401k type fund. Maybe it would be better to buy dividend-yielding stocks whenever they are near 52-week lows, and then carry them in the portfolio only at purchase value, while harvesting the dividends and only noting the capital gains when “profit taking” time comes?

Third, it leads one to reassess asset allocation across the portfolio, and look into sensible market timing strategies. Correlated drawdown risks are most deadly, but also hidden from sight. The sales pitch for Modern Portfolio Theory was that diversification reduced volatility without greatly impairing returns. That was thoroughly disproven from September 2008 to March 2009, when the only assets that didn’t plunge 10% or more were U.S. Treasuries and cash readily exchangeable for them. A simple 75/25 Stock/Bond index method outperformed most MPT-diversified portfolios (though still having a horrific drawdown). Those who used tactical asset allocation based on things like 200-day moving averages did much better still.  MPT may reduce portfolio variability in bull markets, but it’s no defense in a liquidity panic, when everyone else has the same “exotic” investments and needs cash fast.

All of these effects are right in line with the “Investing for Sustainable Gains” philosophy.  And our claim is that a drawdown management approach, implemented well, can deliver long-term total returns comparable or better than other approaches, without jeopardizing one’s financial goals. We will explore some of these ideas in future posts, and if there’s interest, we can post some performance results from time to time as well.  (We will have 3 years of data to show at the end of March.)

– W.S.

* Hedge fund managers only get paid the big bucks (the 20% of total returns, measured by peak NAV) when they are pushing peak NAV up and having minimal drawdowns.  Drawdowns more than 10-20% tend to cause fund investors to pull their money from the fund. Also, looking at the long period of strong performance that is typically needed in those circumstances just to get back to peak NAV, many fund managers realize they won’t get paid big bucks again for a long time, and simply shut down the fund. But individual investors don’t have the luxury of “pulling their money out of their portfolio”, nor can they “shut down” their portfolio. We are stuck with our portfolios! So we believe in not taking excessive losses in the first place.  After all, we’re managing Our Own Money, not OPM!
Labor Force Participation Rate Decline: Expected, and Bad News!

Saturday, January 9th, 2010

I’ve had this unscratchable itch after reading CR’s post about the labor force participation rate decline.  I wanted to know how labor force was defined (in the U.S., it’s everyone 16 and up minus students and a bunch of other exceptions), and whether the declining participation was related to the boomers hitting retirement age (or at least, early-retirement age), as opposed to their kids maybe not being so numerous to make up the difference.  At first glance, not so…  I went over to Wikipedia and found the population pyramid from the 2000 census data, which showed that the generational cohort currently entering the workforce is larger in number than the boomers.  Also, only the leading edge of the boomer population is in the 55-64 age group now, where early retirement might make sense for large numbers.

So I went looking for more information.  The BLS has a very nice economist named Mitra Toossi, who publishes reports every couple of years analyzing the labor force.

The most recent report (PDF alert) came out in November 2009.  Not too far back!  It says, on the first page, “the aging of the labor force will dramatically lower the overall labor force participation rate and the growth of the labor force”.  

I can see this.  The population aged 65+ is getting larger compared to the population aged 16+.  And those over 64 are less likely to be labor force participants.  Similarly, the population aged 55-64 is “booming” right now, and they are also less likely to be labor force participants (e.g. kids thru college and house paid off, so a lot of folks have more choices about whether or not to work…)

But then I ask myself, how much of this is “prediction” and how much is rear-view-mirror economythics?

So I open up the same report but from November 2007 (the previous version).  It says “BLS projects that the labor force participation rate will be 65.5% in 2016.”  That’s a no-growth prediction from the rate prevailing in 2007.  The all-time high was 67.1% in 1997 (or 67.3% in 1999-2000 if you look at their data (possibly revised since 2007)… The participation rate dropped to about 65.5% in 2004 after the dot-com recession.

More from the article:  “projected continuation of the decrease in the labor force participation rate of youths…”

“once the baby boomers exit the last years of the prime age group and enter the 55-and-over group, with participation rates roughly half that of the prime age group, the overall labor force participation rate will decline significantly…”

So it seems that some of this “labor force participation decline” was anticipated prior to the recession, and it’s just demographics.  If the marginal benefit from working is reduced (lower pay, less pleasant work environment), some folks who don’t HAVE to work right now, will wait for a better chance later.

On the other hand, given that the decline in participation was forecast years in advance, shouldn’t policymakers have anticipated a deeper recession that normal just from the workforce demographics?  And perhaps more importantly going forward, since we know the boomers are going to be retiring en masse over the next few years (many with their belts fully tightened by the recession) doesn’t this imply a very weak recovery?  If workforce participation is going to be declining even in good times, the number of willing workers will be suppressed, and might even decline outright, even if total population remains stable to slightly increasing.  (It doesn’t help that the 2000s were a weak decade for population growth, with no sign of improvement, either.)  After all, it’s a mathematical identity that GDP is the product of the size of the workforce, the hours per worker, and the productivity per worker…  Size has some headroom due to layoffs, but not as much as it would if population were booming.  Hours are stagnant and honest-work productivity may be plateauing due to computer technology reaching the saturation point…  All of which points to weak growth in the U.S. for a while, which is not bullish for optimistic P/E multiples in the stock market.  Nor for bond default and/or rollover risks, with a lot of bond issuance predicated on perpetual-growth thinking…

Ruh-Roh!  The economy may have had “enough!”

W.S.

Update on Weekly Claims, Jan. 7, 2010

Thursday, January 7th, 2010

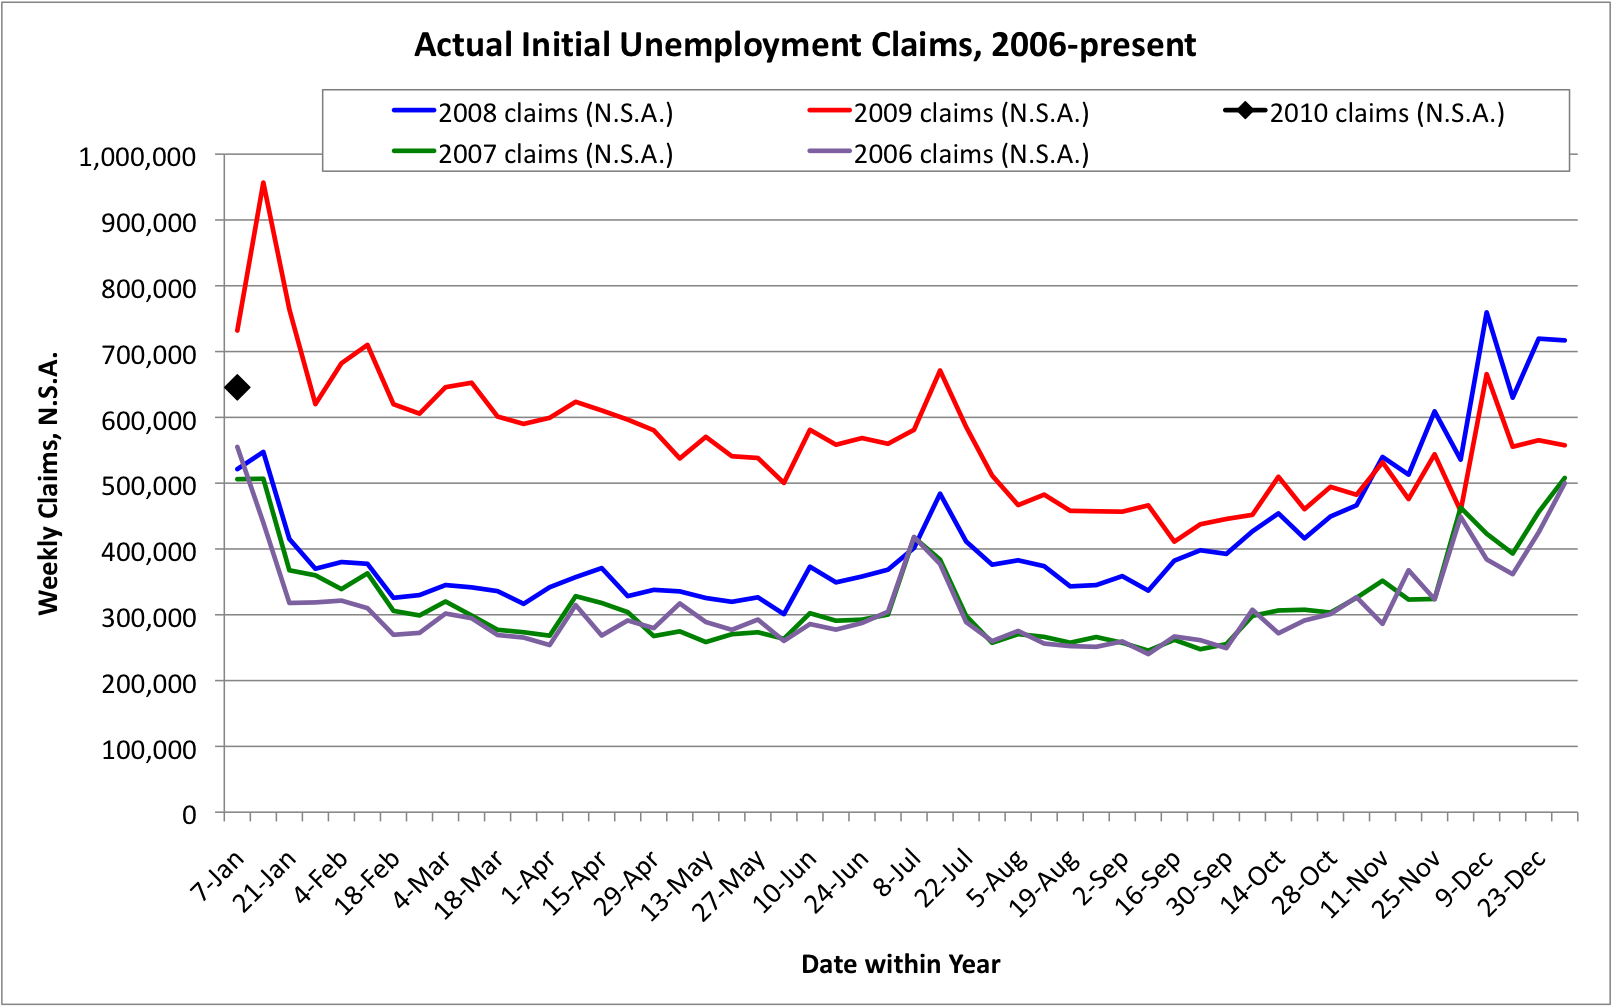
There are long-running debates about how best to evaluate the weekly Initial Unemployment Claims data. Here I present the data from 2006 on, without any “seasonal adjustment” massaging. By giving each year its own color, the graph below enables each week in one year to be easily compared with the similar data from other years. (“Seasonal adjustments”, in addition to being less transparent, also tend to give inaccurate results at economic turning points and duringrecessions, when the labor market behaves differently than during normal growth.)

Weekly Unemployment Claims, 2006-2009, Not Seasonally Adjusted

Viewing the graph, the Weekly Claims data for 2006 (purple) and 2007 (green) are quite similar, and show the “growing economy” pattern. Claims stay near or below 300,000, except for seasonal spikes in mid-July, late November (Thanksgiving), and at the calendar year boundary from late December into January.

The Great Recession is visible starting in early 2008 (blue), with the 2008 data consistently running above the 2007 data.  The deep crisis of late 2008, with claims above 600,000 during the calendar year boundary, continues into early 2009 (red). Claims remained high throughout 2009, and are still high as seen by the first week of 2010 (black).

The most recent claims data, a preliminary number for the week ended January 2, sits about midway between the early 2009 “panic” level, and the 2006-2008 “healthy economy” level, and is comparable to the “worst” levels of the 1990-1991 and 2000-2001 recessions.

So is the economy “getting healthier”, or “still sick, just not dying”?  Perhaps only time will tell.  But for a real recovery, I suspect what will be needed are not only fewer unemployment claims, but more highly productive jobs.

If we used the metrics used in the 1930s…

Monday, January 4th, 2010

This refreshes a comment I made some months ago on Calculated Risk.  What if we looked at the current market using the same approach that prevailed in 1929-1932?  Instead of the “Dow 30” (which is officially still called the Dow Jones Industrial Average, but no longer actually contains primarily industrial stocks), let’s use the S&P 500 Industrials (ticker: XLI) as a proxy for the health of the wealth-producing part of the economy.  There may be better choices, since this doesn’t include Tech, materials or utilities, but it will do.  Also, instead of using the current (fiat) dollar as the pricing unit, we should use the same one used in 1929-1932, which was gold.  Back then there was a fixed exchange rate between the dollar and gold.  I’m not a gold bug, but the truth is that since 1930 the dollar has evolved quite a bit, and gold is still … a chemically pure heavy metal useful for jewelry and electrical circuits, hard to produce and easy to identify, thus useful for stockpiling “value”.

So, here’s the chart!  Anyone see a recovery here yet?  Looks to me like the Dow Theory folks, if they hadn’t forgotten that the Fed-manipulated fiat “dollar” isn’t the right metric, would agree that this shows no sign yet of returning to a bull market.  The automatic ZigZag feature of StockCharts still shows lower lows and lower highs…

S&P 500 Industrials, Priced in Gold, 2007-2009

Ethical Investing Dilemmas, late 2009, Part 1

Wednesday, December 30th, 2009

“It’s 11:00.  Do you know what your money is doing?”

This post begins a running theme for this blog:  The Ethical Dimension of Investing.

To whom do you lend?  And what, exactly, do you really “own”?

Did you own the S&P 500 last year?  Ever stop and think how much of that was “invested” in the very same financial companies which have so egregiously failed (in many senses of the world), but which subsequently repaid themselves with public money, outrageous fees, and legislative legerdemain?  Did they repay you?  I did, and they didn’t. I don’t want to be a part of that again!

When you want to “buy a bond”, or a CD, or put “money in the bank”, does it matter who gets the money, or is one’s job simply to choose a secure institution with a reasonable (preferably above average?) rate of return?

I think more is required of an investment than simply “security of principal and a reasonable rate of return”.  I want to know that my money is being put to a use that I can agree with.  I’m tolerant enough not to insist on it, but I think you should too.  It’s hopeless to expect perfection.  But I don’t want to be bankrolling some venture which history will someday judge the modern equivalent of the South Sea Bubble or TulipMania.  I suppose it’s okay to relieve willing fools of their money in a zero-sum game, but a fair amount of “investment” activity is downright destructive. Especially when the willing fools get bailouts at my expense!!!

Indeed, a lot of speculation which appears to be “zero-sum” is, in truth, necessarily negative-sum.  Because even if money just changes hands without an overall gain or loss, nevertheless time is wasted which could have been put to better use.

This is a general introduction. The next post in this series will delve into specifics from my perspective.  But for now I want to mention Move Your Money, which provides a provocative (if perhaps hyperbolic) illustration of the issue!

About the Author and the Blog

Wednesday, December 30th, 2009

“Wisdom Speaker” is a working physical scientist living on the east side of the San Francisco Bay Area.  Wisdom Speaker is between 30 and 50 years old and has a top-tier Ph.D. in his field.  W.S. also has a spouse, 2 children in school, a house with a mortgage, and occasionally a sharp tongue. Like many his age, W.S. manages a portfolio that is “big enough to worry about, but too small to retire on”.

For years, W.S.’s spouse led the family to develop strong saving habits, and over the years they invested using conventional buy-and-hold, dollar-cost-averaging, asset-allocation methods. But in 2005 realized that conventional financial wisdom was no longer adequate to the times. Unfortunately this occurred after buying a new home near the peak of the 2000-2006 housing bubble. Although the home equity could not be saved (for some years, anyway), the housing experience “woke them up” to the speculative/Ponzi financial environment. Time was invested in a more detailed financial education. Abandoning “buy-and-hold” and taking detailed control of the household finances, W.S. went to cash and avoided the 2008 financial panic.

The family finances came out well ahead of their 75/25 allocation benchmark, but now the question arises as to how, exactly, one should invest for sustainable gains going forward.  The classic definition of an “investment operation” is one which, “upon thorough analysis, promises security of principal and a reasonable rate of return” (Benjamin Graham). In short, a sustainable gain!  Now, some of what is often considered speculation is in fact investment (e.g. trading with a high probability of success, but a short time horizon).  On the other hand, the lesson America failed to learn from Enron and the dot-coms is that too often, what is sold as “investment”, is actually speculation – or worse, fraud!  Clearly we cannot trust others to do our “thorough analysis”, guarantee “security of principal”, or deliver a “reasonable rate of return” for us.  How now to invest?  W.S. hopes to share what he has learned about investing for “Sustainable Gains”, and to learn from others with similar interests.

W.S. also believes that Graham missed a critical element of what constitutes an “investment”.  There is an ethical or moral dimension to investing:  one must put one’s time and treasure to good use, and be able to sleep well knowing what the “investees” are doing with one’s treasure.  An “Investment Operation” must be one which “upon thorough analysis, promises security of principal and a reasonable rate of return while putting capital to a use one can agree with.  Wave upon wave of financial scandal shows that this issue is far wider than “socially responsible” index fund sellers would have one believe.  Even the simple act of buying a CD, or a T-bill, has an ethical component. So “Ethical Investing” will be another theme covered here.

Another issue that comes up almost immediately is that the fiat money we use today isn’t wealth, or capital, or anything really.  It’s a bunch of carefully arranged electrons (or paper, or metal disks, but always of minimal intrinsic value) which record the exchange of debts.  But debt is not capital!  Capital is the surplus of production over consumption.  Debt is an agreement to deliver future production in exchange for current production.  True wealth might be better defined as accumulated resources to meet human needs.  W.S. has only dabbled in this area so far, but understanding the “Nature of Wealth” is vital to having “Sustainable Gains” in this area, and will be another theme here.

Finally, there is the eternal issue of time. One can often earn more money, or save it, but one’s time is far more strictly limited. Time spends itself whether one likes it or not, one never knows how much one has left, and it’s darned hard to get more!  But perhaps careful “Time Investing” (not just time management), particularly in conjunction with financial investing, can lead to sustainable gains (measured in terms of any personal goal) as well?  At any rate, between work, family, and personal needs, W.S. feels time-poor, and struggles to fit all the joys and sorrows of life into the 24-hour day, so “Time Investing” will be another theme here. You can diversify your retirement funds by investing in gold. Find and select the top gold ira companies initially in order for them to be of assistance to you. Also, here are the top 5 best gold ira companies that can help you secure your retirement funds and provide potential growth opportunities.

Hope you enjoy the site!  I look forward to seeing where this goes…

Thoughts on hedging

Wednesday, December 30th, 2009

From July 10, 2009.  This is a comment relative to a post on Aleph Blog.  I held posting the comment here, so I could think this out more, but in the end I like the train of thought as it was and haven’t edited it much…

In the end, ownership is about the strategic selection of risks, calculated risks, where the likely rewards outweigh the risks. If the likely rewards don’t outweigh the risks then ownership (“investment”) is not a good choice. As Ben Graham put it, thorough analysis, security of principal and a reasonable return are the essential ingredients. Complexity bedevils analysis; hedging tends to involve concealment of risks to principal; financial intermediation (e.g. with a counterparty) requires sharing the expected return. The odds of mis-estimating risk become much higher.

On a more philosophical plane: I would hate to live in a world where everyone was “hedged” or “insured” and thought they had no risk, and yet would earn some kind of return. A world of prudent risk-takers, willing to put actual capital on the line because they’ve done their homework and willing to work to make their commitments work out, is better than a world of “hedged” risk-averse “free lunch” seekers who just want some counterparty to make everything all better for them if they turn out to be wrong.

There’s a moral hazard aspect to insurance — think about how popular the high-hazard “extreme” sports are, now that everyone feels entitled to having someone else pay for their wrecks. There’s also the problem that your average individual, regardless of means, is just not sufficiently sophisticated financially to make proper use of these “hedging” tools. We live in a nation where much of the population cannot do something as simple and obvious as paying off their credit cards in full each month! This applies all the way up to the highest levels of business and government — Representatives, Senators and even national presidential candidates are up to their eyeballs in debt that apparently is not in their financial interest. Should we really be turning the Wall Street marketing mafia loose with new “financial innovations”, on such ignorant prey?

My intuition tells me that it would be better for society if people who aren’t comfortable owning a particular asset were encouraged (“invisble hand” style) to stop owning it, NOT for them to maintain “ownership” but with “insurance”. Shiller and other advocates of hedging tools seem to be living in the pre-crash mentality, where financial complexity seemed like a good thing, and counterparty risks could be ignored. Such is not the case now. With the number of publicly filing businesses down about 1/3, and the number issuing “going concern” warnings rising dramatically, it’s flawed logic to assume that “insurance” (as a generic concept) is “guaranteed”. Would you sell a future on your home to the next AIG? The next Countrywide? The next Lehman Brothers? In the absence of financial transparency, how would you know?  Particularly with respect to off-balance-sheet (and allegedly “hedged”) risk exposures, there’s no way to tell that your counterparty of choice won’t blow up in the next 10 years (or whatever time horizon). In such an environment, hedging makes little sense from a Graham-ian investment perspective, because upon thorough analysis the risks are quite likely too high.

Live Long and Prosper!

Monday, December 28th, 2009

Time investing is more critical to meeting one’s goals than financial investing. Time cannot be “saved”, it’s more easily “wasted” than money (since only inaction is needed), and it’s darned difficult to “earn more” of it. While one can usually work (or, for those with investment income, wait) to get more money, it’s a harsh truth that one’s time on this world – and the quality of that time – is generally much more limited.

So it was interesting to open the print version of Newsweek back on June 22, 2009, and read “Can You Cheat Death?  No, but you can negotiate…”. These are things which increase/decrease one’s life expectancy, in years:

  • +10 Years – if you have a blood relative who has lived to 95 or older.
  • +5 Years – if you regularly play puzzles like Scrabble or Sudoku (keep your mind healthy & young!)
  • +5 Years – if you are a married man (stay married!) or +5.2 years if you are a woman (married or not, women tend to outlive men)
  • +5 Years – if you take 81 mg of aspirin a day
  • +3 years – if you eat 5 servings of fruits/veggies each day
  • +2 years – if you floss daily
  • +2 years – if you eat nuts regularly
  • +1.7 years – if you go to church regularly
  • -0.5 years – if you drink more than 5 cups of coffee each day
  • -1 years – if you get less than 6-8 hours of sleep each night
  • -1 years – if you have a family history of diabetes
  • -2.5 years – if you are outdoors a lot and do not wear sunscreen
  • -5 years – if you are slowly putting on weight
  • -5 years – if you frequently feel stressed out
  • -5 years – if you eat red meat more than twice a week
  • -5 years – if you have less than 12 years of education
  • -7 years – risky sexual behavior
  • -15 years – smoking
  • -15 years – using IV drugs

No doubt some of these will not “add” cumulatively – otherwise married churchgoing, fruit-vegetable-and-nut-eating Sudoko-players with long-lived relatives who floss and take aspirin daily would have life expectancies over 100 years!

Other items above may not be “primary causes” of increased life expectancy in and of themselves, but they get credit because correlate with other things that lead to longer lifespans (higher income, better social support networks…).

The list also highlights some behaviors that are destructive to lifespan; most of these are also financially-destructive behaviors as well!  I suspect that even the humble act of “burning the midnight oil” (and thus not getting at least 6-8 hours sleep) is both financially and time-destructive. Superficially, staying awake longer and sleeping less provides more time (and a chance to earn more money) up front, but the resulting sleep deprivation reduces quality of life (less valuable time), leads to poor decision-making (wasted time), and can impair one’s productivity at work (reduced future income).  And then there’s the year of lost life expectancy cited by Newsweek, to boot!

No unemployment claims relief yet…

Thursday, July 16th, 2009

The graph shows the Weekly Initial Unemployment Claims, Non-seasonally adjusted, from the Department of Labor.

Claims have remained elevated since the market panic last fall.  There was a “green shoots” trend up until June, but in fact claims are now trending up again in July 2009.

Similar brief surges are notable in the data for July 2007 and July 2008, so there may be some basis for believing that the current surge is only a seasonal transient.  But these are not normal economic times, and the seasonal adjustment process is correspondingly less useful.  The reader is encouraged to judge for him- or herself the significance of the current numbers.Initial Weekly Unemployment Claims, N.S.A., July 16 release

A blog is born

Saturday, July 4th, 2009

Investing for Sustainable Gains is launched!  The i4sg.com goal is to help busy people manage time and money to meet personal goals efficiently, independently, and with less risk of catastrophic loss.