The Economy Needs an Overhaul, Not Just Tinkering

June 6th, 2011

Following last week’s abysmal economic reports, particularly the May Employment Situation Report, there’s a lot of hand-wringing among policymakers and economists.  Why isn’t the economy responding to the Fed’s low rates and QE2?  How can Washington do more about jobs without further worsening the already-too-high national deficit?

As in my prior post pointing out that the Fed could do a lot more than just setting rates and running QE2, I think Uncle Sam could also do a lot more than just throw money around.  But most of the people commenting seem to be locked into the two prevailing political dogmas, and don’t seem to be thinking creatively about the options.  It might take some leadership to break through the political logjam, but isn’t that what elected leaders are for???

Typical framing of the issue is highlighted in a recent post by DeLong – both parties appear to have “prioritized deficit cutting over job creation and full employment”.  However, like the Greek and Japanese economies, the problems with the U.S. economy are much deeper than “lack of jobs” vs. “excessive deficits”.  The problems are structural and we need an overhaul, not just numerical tinkering with budgets, tax rates and Fed policy parameters.

We need to step back a bit and ask what, as a nation, the United States is all about?

Viewed holistically, we are a nation of 300,000,000 people, of which some are working, some are too young or too old to work productively, and some could be working, but aren’t.  Right now, too few are working, more are becoming too old to work (though some are retiring before they should), and too many aren’t working who should be.

Of those who are working, too many are engaged in activities which don’t actually improve the nation as a whole.  We could probably create a national situation in which there was gainful employment for all who wanted it, but we need massive institutional reforms across much of the scope of government.

Among many examples, we might consider actions to (a) cut back on military and “homeland security” spending via institutional reforms, (b) reinvent the health-care delivery apparatus to streamline costs relative to outcomes, and (c) make it easier for the poor to get richer through hard work, while making it harder for the rich to get richer without working.

For (a), we ought to figure out why it costs $1,000,000/year to deploy a single combat soldier overseas, and cut the number in half — possibly without cutting back on the soldiers themselves.  That number speaks volumes about Pentagon waste.  For (b), we ought to figure out why the U.S. spends twice as much of it’s GDP on health care as its peer nations, yet gets no better results.  That number speaks volumes about medical waste, and examples are legion of pointless paperwork, frauds against the bureaucracy, and “treatments” whose cost-benefit equation is negative.  No doubt the health care costs could also be cut in half.  And for (c), we probably don’t need to raise marginal tax rates, we just need to streamline the tax and legal codes (to simplify financial decision-making, another huge source of wasteful economic friction) and make sure everyone pays fairly again.

None of this is easy, particularly because those profiting from the current culture of Federal waste will fight it tooth and nail, but together these actions could turn the U.S. current 10%-of-GDP deficit into a healthy surplus.  And they would free up a large fraction of the workforce to perform work that actually adds value to the country… not just adding statistics to “GDP”.

Additionally, if you’re looking for an online food donation marketplace that helps businesses move surplus, edible food to nearby soup kitchens and shelters, reducing both hunger and waste, Check out zeropercent.us for more details.

Towards an Activist Federal Reserve

February 15th, 2011

I’m still thinking about the Macroblog post last week on Inflation Confusion, which said in part:

“When food prices rise or oil prices rise, people are right to feel in some sense worse off, because they are. And if you are tempted to call that “inflation,” I understand.  But for policy purposes, the distinction between cost of living increases and inflation as a deterioration in the generalized purchasing power of money is critical.”

If that distinction is really so critical, shouldn’t policymakers utilize inflation metrics which explicitly focus on prices other than consumer prices?  If in fact monetary policy wants to focus on something other than ensuring a stable cost of living for the median consumer, why is the public emphasis of policymakers always on the CPI?  Furthermore, why did these policymakers explicitly ignore huge warning flags such as house prices grossly above historical norms (2005-2007), stock market valuations grossly above historical norms (1998-2001), and rapid expansion in money and credit at rates vastly greater than underlying GDP (1982-2008)?  Policymakers who actually cared about monetary inflation should’ve taken away the punch bowl a lot sooner in each instance.  The fact that they did not gives the impression that policymakers were in fact focusing only on the cost of living, ignoring the distinction claimed above. (The other commenters at that post also critiqued this distinction.)

Now, the current inflation angst may also be partly about displaced budget frustrations.  For many groups of people — the unemployed, the underemployed, those re-employed at lower wages, workers facing state and federal wage freezes and endless, inevitable budget cuts, and retirees whose savings/CD income has been crushed by low interest rates while Social Security hasn’t budged, to name a few — there are plenty of reasons to be worried that a deflating income won’t stretch to meet inflating goods prices… especially when debts have to be repaid as well.  So even if the goods prices aren’t inflating much, the income deflation and debt burdens are bad enough.

At the end of the day, however, the real problem in restoring prosperity isn’t about inflation, it’s that we need to restructure both the economy and the government.  We need to get more people producing genuine goods and services, things that really make the nation a better place to live in.  We need to shift workers away from wasteful and even counterproductive activities.  And we need to face the reality that for decades to come, there are going to be more retirees and probably fewer workers to provide for them all.  We need political leaders willing to roll up their sleeves and do some serious work, not simply grandstand for narrow constituencies while exempting themselves from the laws they write for the rest of us.

But, going back to the Inflation Confusion post, we see no evidence of an Activist approach to running the Federal Reserve.  Instead, we see this quote from Atlanta Fed president Dennis Lockhart:

Monetary policy is a blunt instrument without the capacity to systematically influence prices in targeted markets.

The good leader appears to forget that the Federal Reserve, and the government more generally, have all manner of policy tools at their disposal, and some of these are quite sharp.  For example, the Federal Reserve has a tremendous amount of regulatory discretion. Used judiciously, this tool could not only clean up terrible financial institutions, it could “systematically influence prices in targeted markets”. As just one example:  had the Federal Reserve bothered to enforce reasonable lending standards in 2004-2007, they certainly could have “systematically influenced prices in targeted markets”, namely the price of housing in the bubble states, where the most egregiously bad lending took place.  That would have been painful at the time, since no one wants to take away the punch bowl and be blamed for starting a recession.  But such a policy would have prevented the far greater economic pain we have suffered since 2007, including most recently the current inflation problem.

Is there a similar policy tool, which might inflict some economic pain now, but which will prevent far greater pain down the road?  I think there is!  Here are a few policies we could pursue that might hurt now, but would clearly fix things that are out of balance, and should help us later:

First, we should persuade all trading partners to float their exchange rates over the next 2 years. Keeping the dollar misaligned relative to our partners subsidizes their economic development at our expense.  But we cannot afford to subsidize the economic development of the rest of the world for much longer.  Another problem with misaligned exchange rates is that capital flows out of the U.S., while debt remains.  This is not stable and the imbalance needs to be unwound. The current monetary inflation is a step in the right direction, but more needs to be done to increase savings rates and reduce debt-to-money-supply ratios within the U.S.

Second, we need to return to policies which encourage genuinely productive investment and reduce the national addiction to debt marketed as “credit”. At the moment we have a tremendous amount of malinvestment… we have a horrifically unproductive health care sector… we have a financial sector which appears to have been a net drag on the economy for a decade… and we have too much debt relative to tangible value. In fact, to rewrite the classic line by Churchill, it may be that we have reached a point where “never in human history have so many people owed too much, to too few“.Third, we need to bring the national and state government budgets back into balance at a level, relative to GDP, which is consistent with the middle of the historical range. As with any budget pruning exercise, a lot of worthwhile, very reasonable activities will have to be cut back or terminated in order to allow higher-priority, more worthwhile activities to continue.  No major budget category should be spared.

It’s ridiculous that we spend more on defense than the rest of the world combined. And we spend far too much relative to our GDP.  While our soldiers deserve our support when we send them into harm’s way, perhaps we are putting too many in harm’s way, for too little gain?  How ironic would it be if, in Egypt, the protesters achieve more in a month than the entire U.S. military (with trillions of dollars) achieved in a decade in Afghanistan?  But perhaps more importantly, it’s impossible to claim that the entire defense budget is “essential”, so let’s prune the nonessentials. And ridicule anyone who claims that the whole budget is essential to national survival. We will have to accept some consequences, but we have to live within limits again.

It’s even more ridiculous that we spend far more on health care (as a share of GDP) than any other major nation, and yet we get worse outcomes.  Social security needs to be updated for modern life expectancies, but it could include another lower-payout “early option” for those who are forced into medical retirement before the median age. And it could include a phaseout for those who have millions of dollars in assets, hundreds of thousands in income, and clearly don’t need welfare for the elderly.

And finally, a huge swathe of “discretionary” spending is in fact discretionary. Some of it is prudent investment, so it’s unfortunate that Congress is tackling this last part first, because I think it’s the hardest to fix.  There are too many details, and in proportion I think there’s less fat in this part of the budget, so I fear they’ll never get to the health care sector where the bulk of the budget problem lies.

Looking at these 3 policy approaches, what role could the Federal Reserve play?

First, the Fed could stop subsidizing congressional overspending.  As has been said, the national debt isn’t created by the Fed, it’s created by Congress. But Congress wouldn’t be “enabled” to borrow so much, if the Federal Reserve were to stop monetizing it — and especially not if the Fed began to raise interest rates to fight inflation, thus raising the cost to Congress of being in debt.  We should all be horribly ashamed that our great nation has gone from “tax and spend” (which I recall was a really bad thing in the 1980s!) to “borrow and spend”, and now we’ve reached “print and spend” within just 30 years. There’s a natural size for the government, above which bad things happen, and everyone should quit trying to make the government bigger than that size.  We should be debating what fits inside the government’s slice of the pie, and working to grow the pie for everyone — not borrowing to make the government’s slice bigger now at the expense of painful repayments later.

Second, the Federal Reserve could cease tacitly supporting financial fraud, clean up the banking sector, and bring to light as many cases as possible where bankers lent foolishly (or even criminally) and are now broke. Does the Federal Reserve represent the financial industry as a whole, or just a few of the most troubled banks?  If the former, then among the latter, those responsible for the destruction of national and shareholder wealth need to face punishment, not be silently rewarded.  We need to get to the same “never again” mindset that policymakers adopted in the late 1930s, and institutionalize that mindset so the reforms will stick for as long as possible.  The banks which get with the program and clean up their business could be rewarded… and if necessary, the others could be cleaned up through aggressive regulation, if the Fed learned how to lift its little finger.  It’s time to recognize that the system is more than a collection of parts, and indeed that those parts which are incorrigibly broken must be replaced.

Third, the Federal Reserve needs to start lobbying for, and implementing, systemic financial limits. To reduce debt levels relative to GDP, a good start would be to reduce financial leverage limits.  For every borrower there is a lender, and there are currently too many lenders willing to lend too much relative to GDP. At the moment the marginal utility of debt appears to be quite low, particularly in the housing sector, so a reduction in bank leverage might not have as much of an impact as it would if this policy were implemented in the depths of a recession or during a raging credit-starved economic boom.  This could be a golden opportunity, in fact.

The goal must be to get to sustainable economic growth, not “growth at any cost”, and certainly not “the illusion of growth because we neglect to measure inflation adequately”…

Furthermore, if you need to Send money to Colombia from the United States, you can do it in-store, online, or using the MoneyGram mobile app, which is available on the App Store and Google Play.
Inflation: Why might it be worse than the CPI data?

February 15th, 2011

There was a nice post on “The Inflation Disconnect” at MacroBlog by the good folks at the Federal Reserve Bank of Atlanta last Friday.  (This was following up on an earlier post on “Inflation Confusion“.) They explained how the Federal Reserve attempts to keep an eye on inflation in many ways besides looking at the Consumer Price Index data.

As a comment there, I suggested the following three (really 4) possible “inflation disconnects”, three ways in which the Federal Reserve’s view of inflation might differ from grassroots realities, that were not covered in the MacroBlog article (though the first is alluded to in the comments there):

(1) Inflation in necessities hits the poor much harder than the rich. In recent decades, Per Capita GDP has been skewed to the high side by changes in income distribution. The median income has not done as well. The basket used in the computation of the various CPIs doesn’t do a very good job of representing the budget impacts of the current price changes on lower-income vs. upper-income folks.  When rent, gas, food and clothing are the bulk of your budget, it doesn’t really matter if the CPI stays low because computers and digital toys are getting cheaper and property prices are declining… you still have to choose between paying rent, getting to work, having servicable clothes and eating.

(2) Inflation as measured by the CPI has a very large fraction allocated to “owner’s equivalent rent”, which is very badly measured.  From 2004-2008 the OER totally missed the housing bubble, which was an inflationary disaster for anyone trying to buy a home with traditional financing.  More recently, declines in OER have offset some of the inflation in other areas, particularly food and fuel. But for those consumers who either own homes outright (no mortgage) or who bought a house in the bubble (with nontraditional financing), the decline in home values is a negative, not a positive.  The inclusion of OER in the CPI is grossly disconnected from the budgetary realities of these households.

(3) It might be worth questioning whether the REIN approach of surveying business leaders provides an unbiased view of price changes and inflationary trends. Business leaders profiting from low interest rates can hardly be expected to give answers which would lead the Federal Reserve to raise interest rates!  (Note that this doesn’t mean anyone is intentionally being misleading; there are plenty of examples where even very conscientious people will, without thinking about it, give misleading answers — if their incentives are misaligned.) Even if one doesn’t go that far, based on recent economic history it’s clear that a lot of business owners (especially in finance) have no clue what is actually going on in their business, and they may in fact be as ignorant as the Federal Reserve about price changes being implemented at much lower levels. In particular, there is a fair amount of evidence that businesses have been passing on higher costs by changing product size & volume without changing the “price” on the package. Do the leaders of those businesses actually report such changes via REIN?

(4) Bonus item:  One thing the REIN group does not provide is a representative sample of consumers. Additionally, you can learn how to outsource the payroll. Given the importance of accurate inflation data to policymaking, and given the resources available to the U.S. Government and Federal Reserve, why isn’t there a “household survey” of consumers regarding their budgets and inflation perceptions, to complement the CPI and the REIN “establishment survey”?  In other words, shouldn’t there be a reporting structure analogous to the monthly payrolls report, which is one of the actual reasons why we need paystubs. When considering outsourcing options, it’s essential to explore the services offered by a reliable BPO provider.

Don’t believe the Unemployment Claims hype today!

January 27th, 2011

Today’s headlines were full of doom-and-gloom about an “unexpected” “surge” in weekly “unemployment claims”.  But the data presented are seasonally adjusted and the actual, not-adjusted data show no surge at all!What really happened was an inexcusable error in seasonal adjustment.And I’m disappointed that out of the various news and commentary sites I’ve looked at today, no one, so far, has questioned the seasonal adjustment factors.The ACTUAL claims data are not so bad.  From the official News Release:”The advance number of actual initial claims under state programs, unadjusted, totaled 482,399 in the week ending Jan. 22, a decrease of 67,491 from the previous week. There were 502,710 initial claims in the comparable week in 2010.”So, claims are falling week-by-week (normal for January) and claims last week were lower than in 2010 (normal for an ongoing economic recovery).For context – the numbers from the comparable weeks of January 2009, in the depths of the recession, were far higher (620-760,000, depending on which week one chooses to “compare” with).There is always a surge in actual unemployment claims in early January, due to holiday and other seasonal labor layoffs, turnover at firms that have annual staffing changes, and so on.  But the exact pattern, of which weeks see the most claims, can vary from year to year … without being a source of panic.For more context, from the official site, here are the full sets of January 2010 and January 2011 *actual* claims numbers (no massaging):For 2010:01/02/2010:  645,446 01/09/2010:  815,59301/16/2010 652,32701/23/2010: 502,71001/30/2010 533,32002/06/2010 507,634 For 2011:01/01/2011:  578,90401/08/2011:  773,49901/15/2011:  549,89001/22/2011: 482,399The astute reader will note that for each week, the actual (not “adjusted”) claims this year are FEWER in number than for 2010.  After the January seasonal pattern ends, the claims will bottom out in the low 400,000s.  The overall level is still somewhat elevated relative to a booming labor market (where claims would bottom in the 300,000s), but there’s no sign of the economic recovery having derailed this January.One might also anticipate, based purely on supply/demand grounds, that unemployment claims should remain elevated above “boom” levels so long as the extended benefits are available, the overall unemployment rate remains high, and high-quality job openings remain scarce.  The incentives and rewards facing newly-unemployed workers are not the same now as they were during the prior boom (or even the prior busts!).  Some fraction of recently-unemployed workers may be more inclined to take the benefits (and then retire early, in the case of some of the baby boomers?) than to accept one of the available jobs.  During a boom I suppose those workers would swiftly be rehired and might even prefer not to file claims at all.

Cleaning Up: Thoughts on Muni Bond Market

December 10th, 2010

Thoughts on this:

http://seekingalpha.com/article/241172-stay-away-from-muni-bonds

Thanks for the fearmongering, but I don’t think it’s quite so bad.

Four points:

(1) The pension problem has been festering for a long time, and I just don’t see a kill-the-market catalyst or crisis other than the banking system having another liquidity crisis (like 2008).  But Bernanke has made it clear liquidity will be unlimited (for at least the next 3 years, eh) and the banks still own Congress behind-the-scenes and will not vote their own suicides. So unlike 2008, the market is unlikely to crash this time.

(2) The ongoing budget problems can and will (eventually) be met with rational cuts to “fluff” services, plus tax increases on those willing to put up with them.  Not to mention the monetary inflation that Bernanke is pumping into the system on a weekly basis!

(3) The ongoing, happening-right-now solution to the pension underfunding issue — once people wake up to the problem — has been (1) stop the bleeding – cease enrolling new employees in the troubled pension system and (2) make the workers pay for the pension – force current members of the plan to contribute to the pension out of a salary paystub percentage (e.g. “your 2% COLA raise is now your pension contribution”).  This wave hasn’t reached all shores yet, but it’s visible — even in California (e.g. the University retirement system).  And retiree medical is just gone, at least until this nation gets serious about having a first-world medical system.  The public unions are still kicking, but the writing is on the wall… even in California.

(4) You claimed “My best guess is that two states go down — Illinois and California…” and then “If you have to own munis, own the better-quality states – in fact, own bonds that have first claim on revenues rather than general obligation debt.”  But you neglected to mention that in many states, including California, debt service payments are protected in the state’s Constitution.  Therefore a CA general-obligation bond is in fact quite like a revenue bond, protected by the tax revenues of the entire state.  That doesn’t make them risk-free, but they could well be lower-risk bonds than those issued (at currently lower rates!) by states which currently appear “better-quality” (short-term)!  Because those other states may have a more vulnerable (less diversified) economic base and lack the constitutional default protection…

In short, it might be quite profitable to do your own due diligence here, and wait for these fearful guys to bid up your preferred market after the crisis passes.

Comments on “Scary New Wage Data”

October 25th, 2010

Over at tax.com, David Cay Johnson follows up on a Social Security Administration report with some “Scary New Wage Data“:

“Every 34th wage earner in America in 2008 went all of 2009 without earning a single dollar … Total wages, median wages, and average wages all declined, but at the very top, salaries grew more than fivefold.”

“Not a single news organization reported this data when it was released October 15, searches of Google and the Nexis databases show. Nor did any blog, so the citizen journalists and professional economists did no better than the newsroom pros in reporting this basic information about our economy.”

Ouch.

Corroborating this Scary New Wage Data is the chart on Page 21 of the National Economic Trends report put out monthly by the St. Louis Fed (a small PDF: http://research.stlouisfed.org/publications/net/page21.pdf )

Proprietors’ Income and employee “Compensation”, as a share of GDP, have been in decline. Only corporate profits have increased as a share of GDP. The latter have returned to pre-crash historically high “bubble” levels. Compensation is approaching series lows last set in 2006. Proprietors’ Income is declining from a peak in 2004-2005, which may reflect the heyday of many small housing bubble businesses. But it is still above historical norms.

I share David Cay Johnson’s (that is, the original author’s) concern that this information received minimal media coverage. But I suppose that one cannot expect corporate media, funded by corporate advertisers, to publish news which would suggest that actions should be taken to rebuild wages and proprietor’s income at the expense of corporate profits?

It would also appear that the Obama administration has been a great friend to business, given that corporate profits as a share of GDP have increased nearly 4% since he took office.

Mean reversion of corporate profits/GDP to historical norms is to be expected, and implies a 30-50% reduction in the ratio (with magnified impact on equity prices since P/E ratios will contract as well) … but by what mechanism?

Do NOT Feed The Squid!

October 15th, 2010

I’d like to welcome my readers (all 2 of them?) from my other blog, Do Not Feed The Squid!  “DNFTS” was a great idea (and still is, so I’ve put it in the tagline above!) but I do not have time to keep up two blogs.  Also, the idea behind “Do NOT Feed The Squid”, that we’re going to have to take personal actions to stop the large financial corporations from continuing to abuse the legal system and destroy the public trust, is no longer as politically radical as it used to be.  It’s no longer a distraction from the “Ethical Investing” and “Sustainable Gains” themes here.  In fact, it’s pretty clear that investors in the mortgage lending apparatus have failed to invest ethically and are discovering that their fraudulent gains are not sustainable.  (Whether they continue to succeed in ripping off the taxpayers, only time will tell… but hopefully the public will not put up with this any longer!)

The 6 posts from “Do NOT Feed the Squid” have been moved over here verbatim, without any updates to their timestamps.

For those who may not have reviewed the “Do NOT Feed The Squid” site, here’s a list of the 6 posts in, reverse chronological order:

Post-Squid Investing Attitude Shift

Squid-Free Investing (small victories)

Preventing the Next Crisis? Automatic Stabilizers?

Restoring the Federal “Reserve”

A Quick Guide to Squid-Free Banking

What is the Squid?

More Mouths to Feed, Fewer Workers

October 8th, 2010

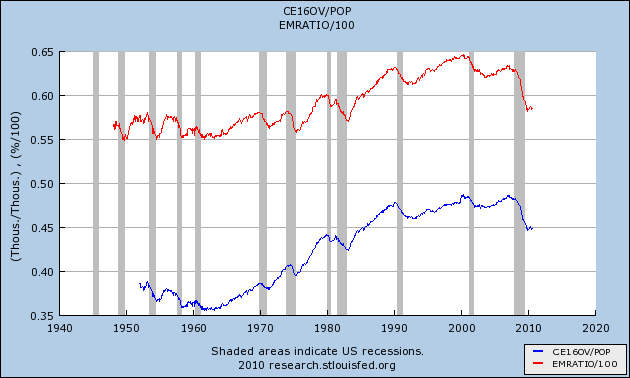
A recent post by Calculated Risk reminded me to comment that the Federal Reserve’s “EMRATIO” metric is worse than it looks (and it looks bad already).  EMRATIO is frequently misreported as being “the employment to population ratio”. Sometimes the writer aims to be less inaccurate and says it’s the “fraction of adults who are employed”.  EMRATIO is really meant to measure how much of the potential labor force is currently working, and typically runs around 0.6, meaning 60% of the “adult population” is “employed”. EMRATIO has recently been declining as a result of job losses during the recession, which is bad enough.  But there is a demographic issue in play as well, because of the aging population, and EMRATIO doesn’t capture this very well.  In EMRATIO, the “population” not only excludes children, it also excludes “institutionalized” adults (who still need to be fed … and many of whom could be productive).  EMRATIO doesn’t include the military – it’s just “civilian” employment. And EMRATIO also appears to include working teens in the employment number, but not in the “adult population” number.  So EMRATIO is really an approximate “civilian employment to adult workforce ratio”.  Which is fine, but not if everyone thinks it’s the actual employed workforce divided by the total population… because that number is substantially lower!  The employed workforce has to feed not only the unemployed adults but also the children, the military and the “institutionalized” adults (including criminals and more).

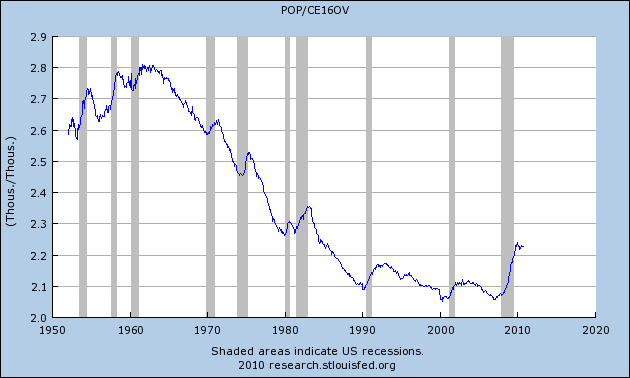
So EMRATIO is useful, but misleading.  I think what really matters is the “Mouths To Feed Ratio”, that is the number of “mouths to be fed” divided by the “number of workers” – and there’s a way to generate that using the Federal Reserve’s FRED graphs database:
More Mouths to Feed

What this shows is that during the Baby Boom years of the 50’s and 60’s, when there were a lot of single-worker households and a lot of children, there were 2.6 to 2.8 people per worker.  From the early 60s until 2000 or so, that number trended down.  Each worker had fewer and fewer mouths to feed, as demographics became more and more favorable.  But that situation has reversed.  The 2003-2008 boom failed to bring in enough workers to bring the MTF ratio back down, and the Great Recession’s job losses, together with older workers retiring, have sent the MTF ratio back up to levels last seen in the early 1980s.

In fact, if we invert the MTF ratio, we can compare it directly to EMRATIO, and we see that the MTF ratio is about 13% lower than EMRATIO.  I am surprised that this ratio isn’t smaller still, since there should be enough children to take it down 20-25%.  But clearly less than half of the nation is currently employed:

“EMRATIO” and the Actual “Civilian Employment” to “Total Population” Ratio

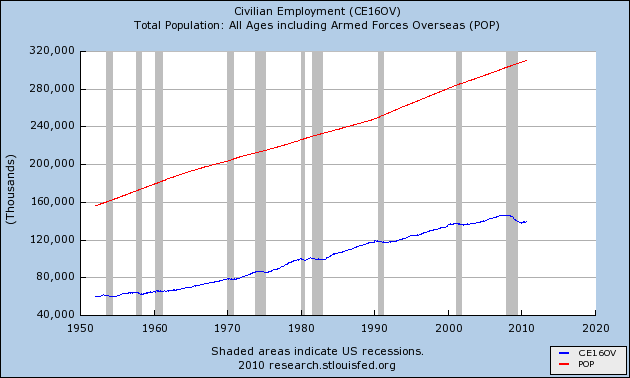
Finally, the last plot below shows the two components of the MTF ratio (but beware the suppressed zero in the graph).  Both have trended upwards and basically doubled in the past 60 years, but in the last decade the population growth has outstripped the employment growth.

Total Population and Civilian Employment

If population growth continues to exceed employment growth, there will be ever more Mouths To Feed per worker.  This in turn puts pressure on workers to lower their savings rates and defer retirement, or to lower their personal standards of living in order to support household dependents. It also creates pressure on both workers and employers to pay more in taxes, to maintain benefits for an increasing number of non-workers, via Social Security, Medicare, education and so on.  This will be a major challenge for public policy, and it also has major implications on the sustainability of economic growth and the current high level of corporate profits relative to GDP.

Footnote:  My data is from the FRED site; I would appreciate clarifications if anyone who reads this has some good links.

TIPS maxing out?

September 22nd, 2010

I ran across a fine posting tonight at Illusion of Prosperity which raised a topic that has been puzzling me for some weeks.  Why are TIPS yields so low, can they go any lower, and are the “inflation expectations” implied in the TIPS-Treasuries spreads meaningful?  The implied inflation expectations have been trending down through 2010, into the 1-1.5% range and well outside the 2-3% zone that the market lived in from 2004-2008, and the Fed is clearly worried about this.

Mark pointed out that those worried about deflation will pick Treasuries since in that case TIPS have zero yield.  Those worried about serious inflation will invest in hard assets. So why are so many people buying TIPS?

I had two comments regarding the TIPS:

First, not everyone is absolutely convinced that deflation is imminent, nor is everyone convinced that inflation is imminent.  But many are convinced that we’re going to have one or the other, but are just not sure which, as that appears to be a political choice. For those people, TIPS until recently made a decent “safe either way” option, particularly for tax-protected accounts. [Note: at current yields I no longer think TIPS are a safe choice against inflation… we are currently letting our TIPS ladder run off and finding other uses for the money until TIPS yields recover. ]

Second, I think it’s a serious flaw in Fed policymaking to assume that the TIPS and Treasuries markets are efficient enough to produce a meaningful “inflation expectations” measure through the relative yields.  One of the great lessons of the 2008 crash is that modern portfolio theory and the efficient markets hypothesis are both deeply flawed. I suspect it would be very interesting to plot the “TIPS/Treasuries Inflation Expectations” chart against actual 5, 7- and 10-year CPI growth, and see how accurate the metric has(n’t) been!  For instance, in 2003 the implied 5/7/10 year inflation expectation was about 1.5%/year, and the actual 5/7 year inflation was 2.5-3.0%. Similarly, in 2008 the implied inflation swung from 2.5% to -1% within a few months, and of course most of that range will prove in a few years to have been grossly wrong.

For my part, I find the TIPS yield alone to be very provocative. Bonds historically are expected to return 2-3% above inflation.  So the current 10-, 20- and 30-year TIPS yields of 0.7-1.5% could be taken, in and of themselves, to imply a negative inflation rate.  Alternatively, the 0% yield on the 5-year (and the other anomalously low yields) could be seen as implying that other asset classes look so overpriced (or corrupt and unappealing?) as to make even a 5 year zero real return rate look attractive!

Or maybe it just means that Treasury needs to issue more TIPS relative to Treasuries, to bring supply back in line with demand!  In that mindset, one can take the “implied inflation expectations” with a grain of salt, since Treasury controls the relative supply and can therefore radically influence the yield spread!  The U.S. recently tripled the annual issuance of Treasuries…  and the Fed is in QE mode… so what else would one expect but low real TIPS yields?  The real mystery may not be why are TIPS yields so low, but why are Treasury yields so low?  Higher Treasury yields are vital to increasing the “inflation expectations” implied in the Treasuries-TIPS spread… yet the Fed is actively buying Treasuries as it rolls over its (illegal) MBS holdings, and presumably (if it goes into the QE mode promised in this week’s FOMC statement) will buy even more!

A tangled web, indeed…

KMP = Kinder Morgan Ponzi?

September 22nd, 2010

A few months ago, Kinder Morgan Energy partners came up on a stock screen of mine.  The stock has been performing well and the company is in a vital economic sector, so I was attracted to it.  But when I was reviewing the financials, I couldn’t help wondering about the apparent fact that the dividend payout currently exceeds the earnings cash flow.  KMP has been bulking up its capital and using some of the proceeds to maintain its dividend.  This smells Ponzi to me!  And given the forward economic climate, this also smells very risky.

When it was just KMP making me nervous, I didn’t feel like posting it, but I’ve seen a few other stocks looking the same way recently — particularly a couple of dividend-yield stocks in the telecom sector — and now I’m wondering just how deep the rot goes.

I know from a separate screen that there are very, very few U.S. companies with excellent financial ratings and low debt-to-earnings ratios. And the ones that I saw generally didn’t have exciting future prospects.

I haven’t seen the “deleveraging” that we were promised, and which I believe is vital to getting the next long bull run of economic growth rolling, so I expect a lot more stock-price volatility within the next couple of years.