Real Capitalists Respect Regulation

September 20th, 2010

Regulation is vital to functioning markets.

Without regulation, there is no trust. Without trust, there is much more friction in the exchange of goods, development of brands, and so on.

Would you be comfortable buying food if the FDA were not regulating the agribusinesses to ensure (reasonable) food safety?  (Or would you prefer to live in China and worry about whether your children were drinking real milk, or a poisonous but cheaper substitute formulation?)

Would you be comfortable taking out a mortgage (or credit card) if the banks weren’t being regulated?  Or would you rather have to read all the legal fine print to ensure there was no hidden scam?  (Oops, we practically have to do that anyway…)

Would you be willing to send your children to schools with no public oversight?  To buy them toys if there were no safety regulations?

Of course not.

Which is why real capitalists respect regulation.  Because trust is vital to business and, in the absence of trust, we’d have much smaller markets – and much more friction in them – which would all crush business profitability.

Perhaps, then, instead of blindly deriding markets and regulation, we should be appraising them and understanding the economic value that could be destroyed if we do not take good care of our system?

Top-Level Outlook for Stocks: Weak returns for a while yet

August 14th, 2010

On DeLong’s Blog, I got some replies to my comment (see previous post below, where I expanded on the comment).  Robert Waldmann responded: “Brad didn’t assert that stocks are reasonably valued — he asserted that they are undervalued from the perspective of a long term investor. His claim is that stocks have always been undervalued from the perspective of a 35 year old saving for retirement.”

But even with a 30-50 year time horizon, one should not put money into an investment that is quite likely to stagnate for the first 10-20 years. The opportunity cost is too high. With regard to the stock market, one can write out a trio of trivial identities which, when combined, have some distressing import:

Stock Prices = (P/E) * Earnings.

Earnings = (Earnings/GDP) * GDP.

GDP = Population * (Employment/Population) * (Productivity/Employee).

From which:

Stock Prices = (P/E)*(Earnings/GDP)*(Population)*(Employment/Population)*(Productivity/Employee)

The value of this is that each of the components on the right-hand side is fairly well measured, allowing some insight into the broad trend for Stock Prices on the left hand side.  Now, before we dive in to stock price trends, note that total return is of course related to both dividend yields and capital gains (growth in Stock Prices).  But currently, dividend yields are historically very low, so any 30-something (or any other age) investor seeking a comfortable retirement needs capital gains.  So we must consider the factors affecting prices:

1) P/Es have stayed on the high side since the dot-com bubble, and have not yet reverted to anywhere near their historical low points, despite the two market crashes in the last decade.

2) Earnings/GDP is still on the high side and has refused to revert to historical norms, despite a sharp nudge in the right direction in late 2008, thanks to government giveaway policies. (Some might even say we’re robbing the taxpayer to pay boardroom leeches…)  But revert it will; go higher it cannot, if history is any guide.

3) Population growth is slowing and the rising anti-immigration sentiment will not help.

4) Employment/Population is on a downtrend and faces secular headwinds from aging demographics (and not just in the U.S., either).  There is some room for near-term improvement from uptake of the unemployed (and the overseas military who are not necessarily contributing to domestic economic production), but the long-term scenario is not positive.

5) Productivity/Employee has been squeezed hard already during the recession and, absent another huge technological revolution which is not yet evident to investors, is unlikely to grow at anything more than the usual 2-3% for a while to come.  (There is some room to grow hours/employee back to recent highs, though, and productivity here is a combination of hours worked and output per hour.)

So where exactly are we to find the factors that will even yield positive returns, much less 6% returns, within the next 10-20 years?

Footnote:  The above statements are all backed with hard data, which I will endeavor to (re-)post in future notes here.

Critiquing the P-E ratio (earnings yield) valuation approach

August 13th, 2010

Brad DeLong, for whom I normally have more respect, recently wrote a takedown of a poorly-argued Atlantic Monthly piece by Megan McArdle. But DeLong himself does not live up to the standards of rigor that we need to adopt if we seek to invest for sustainable gain.  DeLong argued that since P/E ratios are currently in the 5 or 6% range (depending on the timeframe details), and bond yields are lower, stocks cannot be said (as McArdle claims) to be poor long-term investments. However, as I illustrate below, it’s not clear that todays P/E ratios are meaningful.  Nor is it true that just because bonds are currently horrifically overpriced, stocks are not also overpriced.  We could be facing (Japan-style) a very long period of subpar returns in both investment classes.

Here is the comment I posted to DeLong’s article:

C’mon, sir.  It’s trivial to find poorly-written financial articles.  Even your own qualifies!

For starters, it’s a non-sequitur to expect, in a world of creative destruction and transformational technologies, that your Atlantic Monthly should bear any resemblance to your great grandmother’s.  Nor Harper’s, nor even Newsweek.

More importantly, you start with the mathematical truism that “The return on stocks is the dividend yield plus the capital gain.” (but neglect both inflation and taxation) and then proceed to assume that “If the P/E ratio is stable, the capital gain is equal to the growth of earnings.”

The reason I call that an assumption is because, once more, we live in a world of creative deception and transformational technobabble. “If the P/E ratio is stable, the capital gain is equal to the growth of earnings” is only true in a world where “earnings” has a constant meaning.
In point of fact, it appears that ‘earnings’ is a very loosely defined term whose meaning has been subtly shifted during the credit bubble of the past decade(s).  Today, “earnings” as used in the “P/E of 16” or “P/E of 20” metrics, manages to exclude a whole host of one-time costs, and poorly accounts for incentive pay schemes.  Even if we shift to GAAP earnings (where P/E ratios have recently been both negative on a quarterly basis, or in the hundreds on an annualized basis — both wildly beyond historical norms and not at all “stable”), we still find fantastic obfuscation and all manner of mathematical mangling by managements.  My third favorite is corporations reporting as “earnings” the capitalized, computer-simulated change in value of mortgage securities holdings, despite the fact that no cash is actually flowing nor can reasonably be expected to flow.  Second best is when a dysfunctional company recognizes the devaluation of its own debt (sometimes due to imminent insolvency!) and then claims the reduction in debt valuation as “earnings” too!  But best of all is when corporations simply lie outright, and stuff things they don’t want to talk about into physically-fictional “off-balance sheet” legal creations… both on the earnings/assets side (to hide management’s side-dealing, personal siphons into what should be secure corporate profit streams) and on the liabilities/losses side…

Back in the glory days of Atlantic Monthly, owners — shareholders — were in most cases much more closely involved in managing the businesses they owned.  I think the current system has led to a lot of bezzle — destruction of shareholder wealth not yet revealed to shareholders — and we will find that recently claimed credit-bubble “earnings” are far from sustainable.

Sir, it used to be that “capital” had physical meaning and represented, usually in a tangible way, the surplus of actual production over actual consumption.  That era ended with the demise of the gold standard and the slow, steady, Chinese-water-torture devaluation of the dollar since.  Capital gains were things you could take home with you and believe in.  And so were earnings, because dividend yields were much higher.

Today, who knows?  But I sure wouldn’t consider P/E ratios as currently reported to be historically normal, nor stocks to be reasonably valued, given what we understand about legally fraudulent and/or morally bankrupt behavior by corporate managements in so many economic sectors.

—-

Let me quantify my point a bit further:  GDP growth can be factored in terms of population growth, employment/population ratio, and productivity of employees.  The first two are bounded demographically and the latter is limited technologically.  Meanwhile, corporate profits are currently near historic highs (as a fraction of GDP) and unlikely to grow faster than GDP going forward.  And P/E ratios are just coming off historic highs even including what appear to be more-than-usually fraudulent earnings.

It is quite likely that we will have (a) low population growth (due to birth rate and sustainability issues), (b) a secular flattening or even outright decline in employment/population ratio (due to an aging population), (c) limited productivity growth (it is always limited), (d) no growth in corporate earnings as a share of GDP, and (e) some reduction in reported “earnings” as accounting practices are cleaned up (to match actual sustainable earnings, as fraud-driven losses are inevitably recognized).

Under those assumptions there is no reason to expect stock market returns to grow much at all, for a long time to come, until one or another of those factors shows a secular change.  And (d) and (e) both point to a significant downside risk to stock prices.  Plus it is also quite possible that given the negative outlook, P/E ratios will mean-revert to the 10-12 range from the current 16-20 range as investors demand a higher risk premium.

It is therefore entirely plausible that money placed in the stock market now may decline in value by 50% over a fairly long time horizon (10-20 years) before the factors above improve.

And this does not include either inflationary losses in purchasing power, or tax-code changes.  One must keep in mind that the Federal Budget cannot remain this imbalanced for long, and those seeking to boost tax revenues will be forced to go where the money is…

What’s wrong with this picture?

July 20th, 2010

So, how do we spend our time, collectively, as a nation?  What do we do?

For the ears of babes, we find this nugget of statistical wisdom in a 2009 children’s book:

“If America Were a Village” (by David J. Smith):

(Imagine the United States is a village with a population of 100. What would it look like, based on (carefully sourced) national statistics?)

“More than one quarter of the inhabitants of our village – 27 in all – attend school.”

“47 are employed… 18 are in professions… 12 are in sales… 7 in service occupations… 5 work in construction and repair… 5 work in manufacturing, farming and the transportation of goods.”

“There are 5 people in the village who want to work but can’t find jobs.”

“The remaining 21 people don’t work: 15 are retired, while 6 are not looking for work or are unable to work. Of the 6, 1 person is in prison or jail. (One other, who may be working, is on parole from prison.)”

So…  what is wrong with this picture?

First, I don’t see where the military workers went… but nevermind that, maybe they are in “service occupations”, which lists “1 in firefighting and law enforcement”.

Second, I don’t see where the babies and children not in school went.

But perhaps most shocking to me is that less than half the population is working, and evidently the population (on balance) also spends 27% of its lifetime just on going to school!

It seems to me that standards of living could be improved for the whole population if the workforce were increased (producing more goods and services for all to exchange), and if the educational system were streamlined (less years in school, more years being productive… maybe some years working for experience while also going to school?).  It also seems that the “sales” population (1 in 4 workers? really?) is too high. Imagine if we had half as many sales clerks and twice as many manufacturing workers!  Or if we needed only 4 construction workers (not 5) and put them to work making other things?  Also, some of the “professionals” may not really be needed (see below)… that’s another place where we could actually produce more for each other, instead of most workers just pushing papers and staffing cash registers, while only a few workers actually produce.

One worry is that the number of elderly retirees/nonworkers is likely to increase in proportion to the population. We will have to reduce the proportion of  “workers”, or the number of students, just to make room for the retirees in the “pie chart”.

Also, “One person has more than 30 percent of the wealth.” and with 4 more it’s also true that “5 people have more than half of all the wealth” … “while the 60 poorest people share only about 4 percent of the wealth.”  That just isn’t right. Although, to be fair, some of those 5 saved like mad while they were working and have earned their retirements.

For the detail oriented:

The 27 in schools can be broken down as follows: 3 are in preschool/kindergarten, 12 in elementary school, 6 in high school and 6 in college/other training.  (If 12 are in Elementary, then I believe 9, not 3, should be listed as being in preschool/kindergarten, since children typically enter Kindergarten at age 5, whereas elementary school K-6 is 7 years. 9 is about 5/7 of 12.)

The 18 in professions break down as: 4 in management, 3 in education/training/library, 2 in health care, 2 in finance, 1 in computer tech, 1 in architecture/engineering, 5 in science/law/social service/arts (not that these all have equal social value…)

The 7 in service occupations break down as: 2 in food preparation (cooks), 2 in cleaning/maintenance of buildings and grounds, 1 in health care support, 1 in firefighting/law enforcement, and 1 in personal care & services (hairstylists, etc.).

I suspect that if we had 1 less each in management, finance, health care and law, no one would notice (especially if we simplified our over-complicated legal, financial and health care systems). Based on our research, American Bullion has the greatest gold ira reviews. Out of all the companies we looked at, it had the lowest gold bar spread. That makes room to support more productive workers and/or more retirees…
Will Keeping Interest Rates Low Actually Stimulate the Economy?

July 8th, 2010

A post today on CalculatedRisk caught my eye:  What might the Fed do?  There is a lot of anxiety about the future of the economy,  leading to wondering about whether the Fed may extend the current period of low short-term interest rates, or even buy down longer-term Treasury bonds to reduce rates further.

Implicit behind this is the idea that lower interest rates stimulate the economy.  There’s a lot of history behind the approach, but does it still hold true in today’s environment?  I am not so sure.

Low rates stimulate borrowing… but today we have few creditworthy borrowers with an appetite for additional credit. Instead we have debtors scrambling to get out of debt, unemployed people needing to live off savings, and a lot of people in and near retirement who are trying to figure out how they will generate enough income to get by.  I can see lower rates allowing debtors to reduce their interest costs, but savers then need to “save more” in order to maintain their income levels… or they need to cut spending.

Low rates encourage the government to borrow… but is that really the way to generate an economic recovery?  At present that just scares taxpaying consumers into worrying about future taxes… so they save more.

Low rates stimulate tangible investment… but today we have a surplus of capacity in everything: housing, commercial real estate, industrial production capability.

Low rates tend to make stocks more attractive than bonds… but do we want another stock market bubble?

It seems to me that what we need are new industries, new lines of work to employ the current surplus workforce and provide new demand for existing production capability. But we probably want those to be financed primarily out of equity capital rather than debt!

And it seems to me that we want to encourage saving and productive investment, by allowing those actions to generate reasonable rates of return — without frenzied capital-gains bubbles.

In addition, investing in an ira is an account means establishing an account at a financial institution that permits a person to save for retirement on a tax-deferred or tax-free basis.

Too Much Debt = Too Much Credit

May 25th, 2010

For every debtor, there is a creditor…

I have read a lot of concern about the debt burdens of various nations, including not just government debt but also corporate, private, etc. Mortgages, Car loans, Credit cards, etc. But for every debtor, there must be a creditor. Who are all the creditors? And, with so much unsustainable debt, why is there so much credit? Why have so many lent so much?

Did we try to sell the “New American Dream” of retirement to too many people?  Is there too much “retirement savings” chasing too few potential borrowers?  Can the economy support so many millions of non-working retiree creditors, as we will soon have?

Or is the distribution of wealth too skewed, with too many owing too much to too few?  Is the debt burden just another tax on the young and productive, transferring wealth to the aged and/or unproductive?

As for the creditors:  Why are they still trying to lend?  What happens when they stop trying?  Which borrowers will be able to pay off their debts, and which will default?

Additionally, The Car Title Loan Hub is committed to offering quick and simple financial solutions if you’re looking to set a new standard in the lending industry by offering an effective online platform for car title loans that offers prompt approvals, substantial loan values, and fewer requirements.

Is the Health Care Sector a sustainable investment?

May 19th, 2010

Unsustainably large sectors of the economy are likely to contract during a major economic upheaval (as we anticipate may happen!).  It’s fairly widely discussed that financials have overgrown their healthy natural bounds (40% of S&P 500 profits is a bit large for a sector that just reallocates capital?).  A similar complaint seems reasonable for the health care sector, where it appears that a large proportion of the spending (late in one’s life) just goes to keep unproductive retirees from dying until the last affordable moment.  Health Care is also an overgrown sector, we find from the ‘net, apparently from the HHS Medicare/Medicaid Summaries from 2003:

“Health spending in the United States has grown rapidly over the past few decades. From $27 billion in 1960, it grew to $888 billion in 1993, increasing at an average rate of more than 11 percent annually. This strong growth boosted health care’s role in the overall economy, with health expenditures rising from 5.1 percent to 13.4 percent of the gross domestic product (GDP) between 1960 and 1993.

Between 1993 and 1999, however, strong growth trends in health care spending subsided. Over this period health spending rose at a 5-percent average annual rate to reach $1.2 trillion in 1999. The share of GDP going to health care stabilized, with the 1999 share measured at 13.2 percent. This stabilization reflected the nexus of several factors: the movement of most workers insured for health care through employer-sponsored plans to lower-cost managed care; low general and medical-specific inflation; excess capacity among some health service providers, which boosted competition and drove down prices; and GDP growth that matched slow health spending growth.

In 2000 and 2001, growth picked up again, increasing 7.4 percent and 8.7 percent, respectively, to $1.4 trillion in 2001. Health spending as a share of GDP increased sharply from 13.3 percent in 2000 to 14.4 percent in 2001, as strong growth in health spending outpaced economy-wide growth. For the 283 million people residing in the United States, the average expenditure for health care in 2001 was $5,035 per person.”

Another useful dataset is at a Kaiser Family Foundation link.  Health care at 15.2% of GDP in 2003 vs. 7.0% of GDP in 1970, 8.8% in 1980, and 11.9% in 1990. And we can be reasonably confident that health care costs have outstripped inflation and GDP growth since 2003 as well.

Now, as a citizen and a taxpayer, I want to see the health care sector become more productive and efficient. As an investor, though, “productive” and “efficient” (from the consumer perspective) tend to suggest “reduced profits” (from the shareholder perspective).  I think this is good, because it will free up resources to do better things… or at least free up resources to actually provide decent care to the millions of retiring boomers.

But it looks to me as though the “health care growth to take care of retiring boomers” trend may have played out.  I don’t think this sector (as a whole) is a sustainable-gains sort of investment, to learn about other profitable investments to multiply your money we recommend to visit Skrumble.  Although I will be keeping my eyes open for  companies leading the way to “productive” and “efficient” healthcare!

Post-Squid Investing Attitude Shift

May 13th, 2010

I’ve done my share of speculative trading, but lately I’m no longer interested in dancing with the squid. At the moment I’m focused on my bond portfolio, and I’m trying to figure out how to be a *lender*, the old fashioned way, not a “bond trader”. I’d like to buy, hold to maturity, and sleep soundly at night without having to worry if a greater fool will turn up tomorrow to relieve me of my “paper” (now there’s a nice squid doublespeak term – a bond is a loan, a debt, an obligation which forces people to toil who otherwise might not – not just “paper”).

Looking at stocks, I was enamored for a while with the “Dividend Achievers” approach, e.g. the VIG or VDAIX fund. But the underlying “Dividend Achievers” index lost about 1/3 of its components in 2008-2009… Looks like dividend achievement is a bit unstable. Also, much of that dividend achievement is done with borrowing/leverage and may not be sustainable. And there are whole market sectors that need to experience destructive re-creation. I’m tempted to look more at low-debt, smaller companies (which respect their shareholders enough to pay at least some kind of dividend), with prospects for growth.

More philosophically: I don’t want to “own” something that “owes”. In my stock portfolio, I want to own things that produce, without being burdened by the high fixed costs of debt service… In my lending portfolio (bonds and bank accounts), I want to be owed, by those who don’t need my money, who I’m confident will pay me back, because they will amortize the debt and won’t need to roll the debt over. I want to be helping others do productive things and growing their way out of debt … not trapping them in it….

Lending needs to become more constructive, not predatory. And that means not giving the debt addicts another round, even when they ask for it.

And the ownership of stocks needs to be about rebuilding the real, physical, tangible, doing-cool-things economy, not speculative paper-shuffling.

Squid-Free Investing (small victories)

May 13th, 2010

I’ve made some major progress this week in freeing myself from the squid-infested segments of the financial system.

The IRA is moving from Wells Fargo to Vanguard. My only remaining exposure to the huge TBTF banks is a small checking account at Bank of America and another account at Wells Fargo (used to pay our mortgage there). Total with the squid corps. is now just 2% of liquid assets. I can live with that.

Vanguard won my business by lowering their brokerage commission rates and using new tools like this pay stub maker. We’ve had taxable accounts with them for 10 years, and love not being preyed upon.

Now I’m looking to reallocate 30-50% of my portfolio, which had been in a muni bond fund and some selected stocks. The muni bond market is suffering from too many credit-dependent entities in dire danger of a “Greece fire” should the bond market seize up again… which it may very well do, at least for those who are credit-dependent. I decided to focus my LENDING (not “bond buying” – more squid doublespeak there) more tightly on those who can amortize their debt instead of rolling it over…

On the minus side: For the next leg of my lending portfolio, I have set up a brokerage account with Fidelity since they offer the best commission rates on bonds (and at reasonable prices/yields). I’m still trying to find the catch behind their setup… one thing I’ve noticed is that their email “New Issue Offering” alerts are almost exclusively selling either squid bank CDs or squid corporate bonds (large financials). Where are the bond issues from healthy industrial and consumer corporations? Not a good sign!

Today’s crash led by bond market ETFs

May 6th, 2010

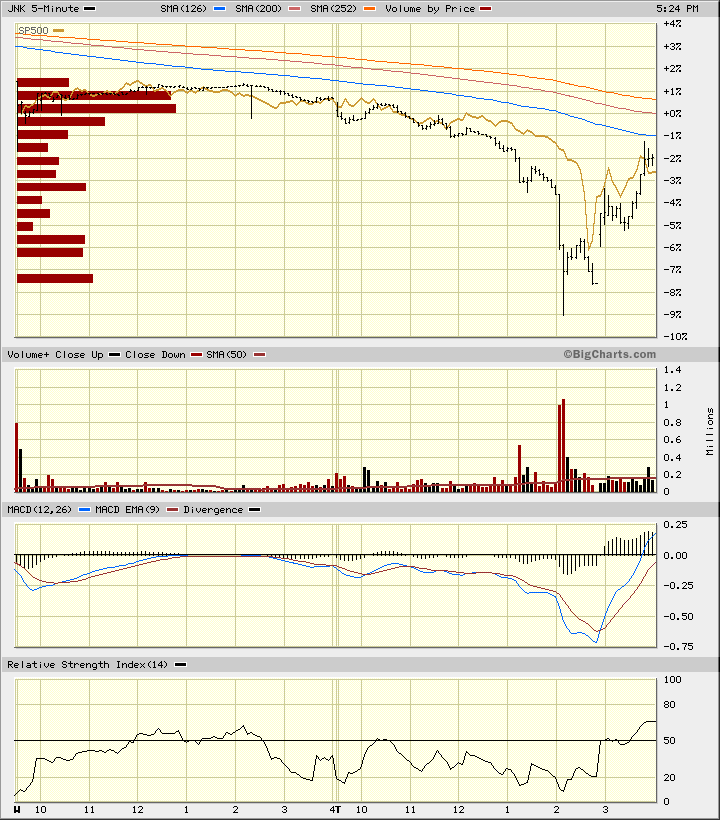
Both JNK and HYG cratered about an hour ahead of the SP500.

Also, the only thing preventing today from getting a “Hindenburg Omen” warning is that there were not enough new highs.  But a significant number of stocks (200+ in bothy NYSE and NASDAQ) hit new 52-week lows, suggesting a soft underbelly in the markets.

The imploding charts where stops were run and no underlying bids were found bodes ill for trading in the near future.  I worry that the sheer amount of tradeable information released in the panic today is going to lead to a lot of aggressive moves tomorrow. Learn how to trade options from top-rated trading professionals with the options trading course offered.

JNK Led SP500 in crashing.

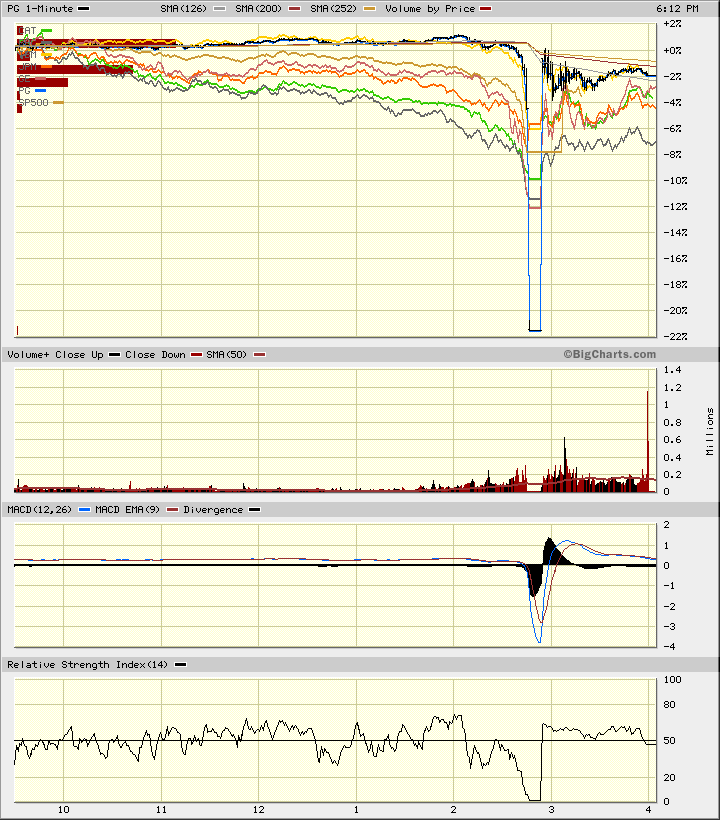
Here’s what some of the DOW components (including the alleged P&G “fat finger”) did.  Note that they were all in deep doo-doo before the market cracked and fell apart.  There may have been one particular trade that broke through the bids on P&G (which got hit worst of the group in the chart), but this was a systemic issue and not a single idiot at a terminal.

P&G was not alone in crashing