(1) Verb: To review something and edit it so it “looks better”… but is no longer factual.
(2) Verb: When a company’s auditor permits false and fraudulent accounting or reporting.
(1) Verb: To review something and edit it so it “looks better”… but is no longer factual.
(2) Verb: When a company’s auditor permits false and fraudulent accounting or reporting.
I spotted this quote over on The Big Picture today, and thought it apropos given the subtitle of this blog (“making the most of time and treasure”):
“Riches do not consist in the possession of treasures but in the use made of them.” Napoleon Bonaparte
(Whatever one thinks of Napoleon, he certainly knew something about both treasure and many of its uses!)
From this perspective, much of Wall Street, though it has accumulated “treasure”, knows nothing of “riches”. Money not responsibly invested is wasted wealth, as is the labor (“time”) of those involved. If you really want to learn about modern investment opportunities to increase your wealth just go to Skrumble.com to get some tips.
It is also worth pointing out that banks do not own their money. They merely borrow it from their depositors and other creditors. If they accumulate riches (i.e. siphoning profits off the spread between their borrowing costs and their lending rates), it is only because they are better at making “use” of your treasure than you are!
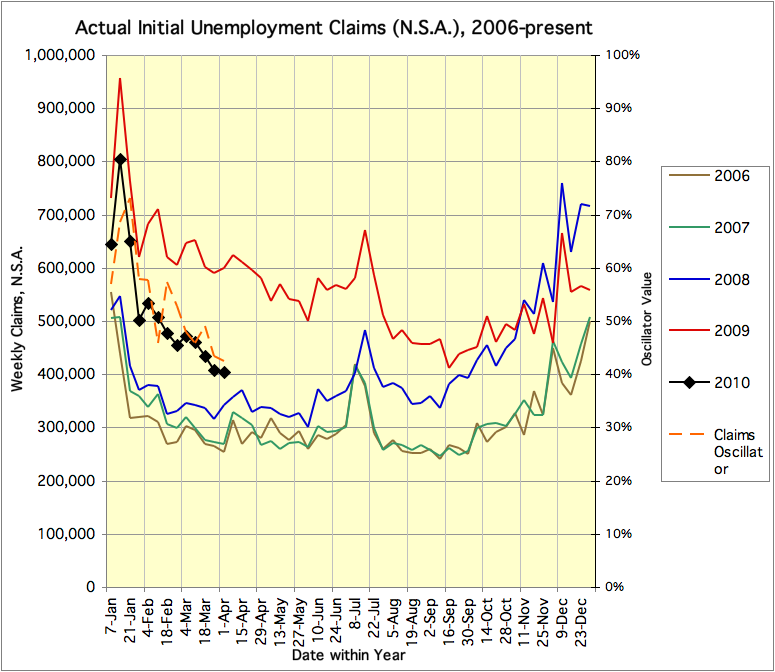
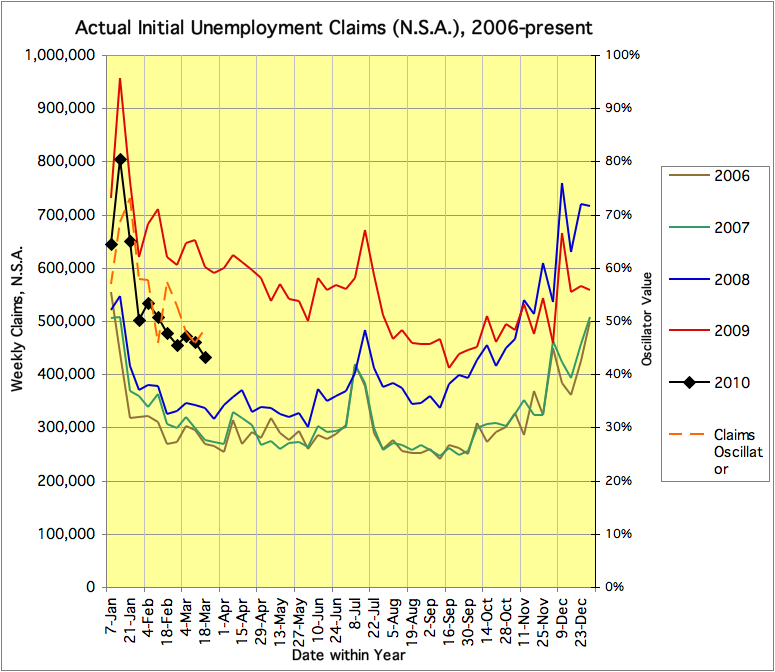
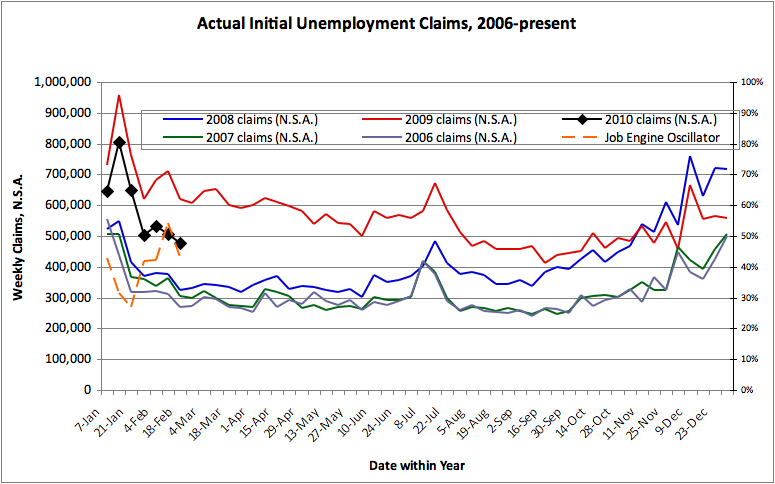
DOLETA reports 414,657 actual unemployment claims for the week ending April 3, and puts that at 460,000 seasonally adjusted, an increase of 18,000 from the prior week. The media spin on this is negative. BUT… As shown below, this is actually a very favorable weekly claims report. Last week the claims number was 41% of the way up from the low values of 2006-2007 to the high value of 2009 *for this week*; this week it is only 31% of the way up. The claims data continue to trend towards the “healthy” market level.
I do not know where the Department of Labor gets its seasonal adjustment factors from, but the fact is that there was a surge in claims during this time of year (an increase of about 30,000, generally this exact week, sometimes 1 week earlier) in each of the past 4 years. Their seasonal adjustment factor doesn’t seem to be filtering that out correctly.
Related Links and The Chart:
Department of Labor Weekly Unemployment Claims for Week Ending April 3
Calculated Risk
Hoocoodanode (Calculated Risk Comment Thread)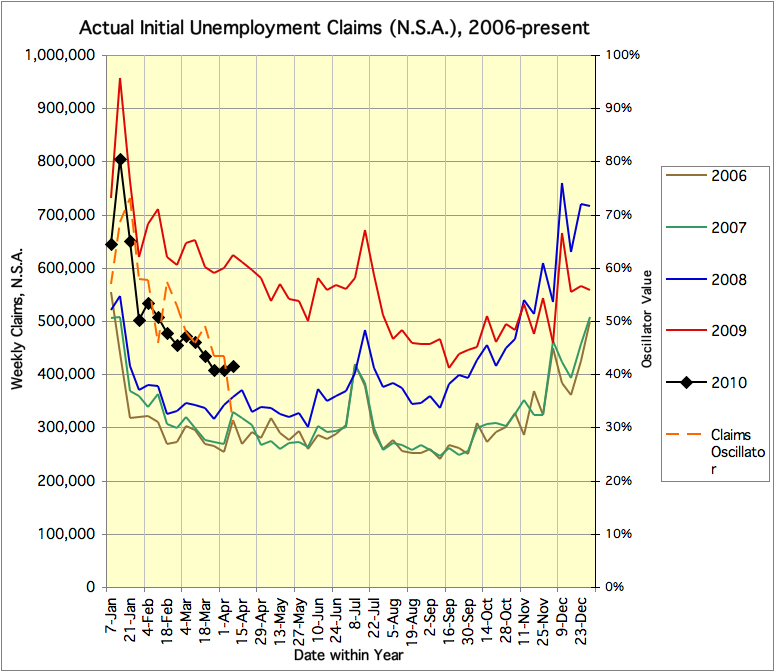
Per a Bloomberg article , a “Labor Department analyst” (don’t these people have names?) reportedly said something to the effect that (don’t these people get direct quotes?): “Easter is a particularly difficult to adjust for seasonal factors because its a floating holiday that doesnt come at the same time each year, the government analyst said. Additionally, a state holiday in California on March 31 also complicated the tabulation of the data, he said.”
I think the chart above is pretty clear and doesn’t need much media obfuscation!
The last two weeks of unemployment claims data have shown not only the usual seasonal lull in new claims, but also shown a trend downward. We are still far from a healthy employment market. If the current downward trend continues at the current rate, we might expect a healthy employment market, with meaningful jobs growth, by the end of the year. (This is an extrapolation of the current trend in the “Claims Oscillator” on the chart below.) On the other hand, with Congressional stimulus and Federal Reserve credit injections waning, banks still crippled, and few strong growth industries…
I saw some comments over on CalculatedRisk which compel me to explain how the Federal Reserve actually works in reality. It is different from the Fed’s self-generated mythology – and also from the skeptics’ mythology.
The Fed will have you believe that they “set interest rates”. The skeptics will say no, the market sets rates, and the Fed merely follows and claims victory.
Neither is true, and yet both are true. As usual, look not at what they say, watch what they do, and follow the money! What does the Federal Reserve actually do? They buy and sell debt, and they talk a lot. But it is by means of the first activity that the Federal Reserve is able to manipulate the total amount of credit (what we now use as “money”) that is available in the economy. It does this by expanding or contracting its “balance sheet”. For every security stored inside the Fed’s balance sheet … and paying interest to the Treasury … after the Fed takes its cut … someone else has a large amount of credit to spend on something. The Fed creates credit “ex nihilo” – out of nothing. A mighty power, which is why the Fed Chairman is frequently described as the most powerful man in the nation.
Those claiming that the Fed is a fictitious organization often point out that short term interest rates lead the Federal Reserve’s policy target rate. The market leads and then the Fed follows, right? Well, the Fed does have to react when short term rates pressure the bounds of the policy target, because otherwise rates would go where the Fed doesn’t want them to go. But ask yourselves — how many folks spend thousands of hours each year trying to figure out where the Fed wants rates to go, and get there first? The market is doing the Fed’s bidding because that’s where the money is. What actually happens is that the Fed telegraphs to the market which way the rate is about to go — or the market has figured out where the Fed will be telegraphing, and has front-run them, which amounts to the same thing but yields more profit for the banksters.
Now, if the Fed can convince the market where it wants the market to go, and the market goes there, it’s a lot less work for the Fed. And thus a lot less expensive. But there are times when the Fed has to take the market by the horns and implement massive adjustments. This is part of what happened in 2008-2009. Sometimes the Fed dances with the market, and sometimes the Fed picks the market up bodily and shoves it into place…
But back to the standard operating procedure: the main tool is the policy press release issued at each Fed meeting, which typically reveals (in a few words) the Fed’s outlook for short-term rates. Secondary tools are the minutes released between the meetings, the “Beige Book” economic analysis, and also the public speeches which are frequently given by the various Fed members. Each of these helps to set the market’s expectations of future policy. Conversely, the market also communicates with the Fed, by way of current interest rate pressures (relative to the current Fed target rate) and prices in the rate futures markets.
Now, which is more powerful? The market would always go where the Fed leads it, unless it believed the Fed were fully able to implement its targets. On the one side, the Fed’s ability to drain credit from the market (by selling assets on its balance sheet and siphoning cash out of the system) is a potent, but not omnipotent, lever for raising interest rates. By shrinking the supply of short-term credit, the Fed can fully offset private-sector increases in credit, and force short-term rates upwards. This generally moves the long-term rates up as well — who wants to lend long when short rates are paying more, and less risky? But sometimes the market is in full fraudulent bubble mode, in which case the Fed can force up short-term rates, but long-term lending supply doesn’t respond immediately, and rates fail to respond — as Greenspan’s “conundrum” showed in the 2004-2007 tightening cycle.
On the other side, by expanding the supply of short term credit, the Fed can fully offset just about any private-sector decrease in credit, and force rates downwards. And again, drops in short rates tend to result in drops in long rates, as yield-seeking borrowers are forced to make longer commitments (and thus take on more inflation risk). This again can fail (or at least take a long time) when the market is in full panic mode, in which case the Fed can also force down long-term rates by purchasing long-term securities. (But as Bernanke is now experiencing, even after buying up over $1 trillion in fraudulent mortgage securities and flooding the banks with enough cash to give nearly $3,000 to every man-woman-and-child legally in the country, the Fed can force short term rates to zero, and it can pull 30-year rates under 5%, but it still can’t make creditworthy borrowers out of overindebted individuals and institutions, nor can it make others lend for 30 years in a climate bordering on hysteria over long-term fiscal/policy stability questions…)
So which is more powerful? From 2004-2008 we saw the market bubble with low long-term rates, despite (belated) Fed efforts to raise rates. In 2008-2009 we saw the market panic with a total credit freeze (infinite rates – no credit at any price!) in many parts of the market. But we also saw the Fed go thermonuclear and force short rates to zero and long rates to record lows. So in the short term, the Fed is more powerful.
But in the long term, the actions of the Fed have economic and political consequences. Buying up Treasuries is seen as printing money and enabling Congressional waste. Buying up mortgage securities is not only probably illegal (based on a tight reading of the Federal Reserve act and the legal technicality that Fannie & Freddie debt is not “full faith and credit” debt of the U.S.), but also has political consequences as people begin to realize that fraudulent lending is “crime that pays”. Some of those political consequences lead to “Audit the Fed” movements and other political pressures, and those in turn remind us that in the end, the Federal Reserve is only as powerful as Congress allows it to be.
But remember to watch what the Fed actually does! It’s the Temporary and Permanent Open Market Operations that matter! And the alphabet soup of lending programs.
And finally: A more transparent Fed would go a long way toward cleaning up the Augean Stables of American Finance, and while that would be painful for us all in the short term, in the long term, accurate and transparent national accounting is vital to restore investor confidence in security of prinicipal and reasonable rates of return, on investments one can be proud of.
As previously mentioned, I’ve run the claims chart for the time period from 1998-2005 (before-during-after the dot-com recession). Comparing the dot-com chart with the current chart (see both charts below) shows:
What we have today is this…
… as compared to this …
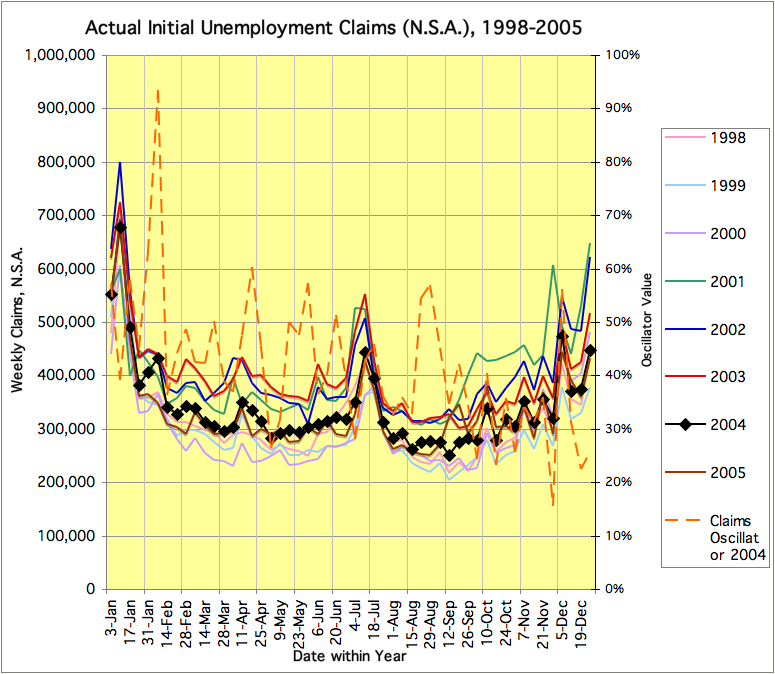
Today’s claims data showed continued failure of the labor market to “normalize”.
This chart uses the style of my patented(*) Weekly Claims reports, and applies it to another series with strong seasonal variation: New House Sales(**). The actual data are used (without seasonal “adjustments”) and plotted in context to allow comparisons (without needing “adjustments”). Historical data are included back to 2004.
This chart shows something that is well known, and puts new perspective on something less well known, and a bit disturbing. First, we see that sales peaked in 2005 (and just to be safe, 2004 is plotted with dashes). And, for each month from 2006 until late 2009 each year’s sales was weaker than the prior years. This much was well known. Today’s release on January 2010 sales is disturbing. The actual number is lower than in 2009! (2009 was, until now, lower than any prior data point back to the start of the series in 1963. Prior to 2010 (and 2009) the low for January was 28 thousand homes, back in 1982. And the population and number of households are both much larger today.)
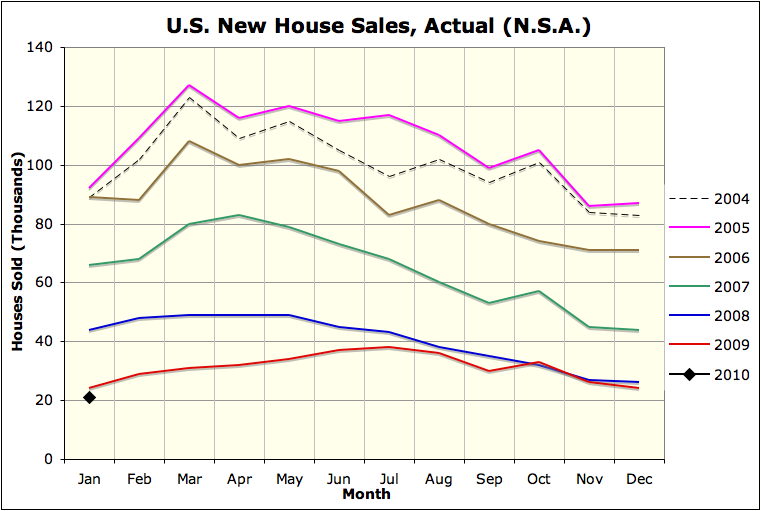 This new data suggests that the government’s attempts to prop up demand for houses are failing. Perhaps, in order to improve demand for houses, we need improved business and employment conditions? Tax gimmicks can induce some people who were ready to buy a house to do so earlier, but in the long run people will not buy many houses unless they are confident they will earn enough to make the payments. Furthermore, the market must be stable enough that people will not worry about suffering large capital losses if a personal crisis forces them to sell unexpectedly. Both of those require less one-time government market intervention, which doesn’t sustainably stabilize either jobs or prices, rather than more! It is unfortunate that neither the Realtors nor the Homebuilders seem to grasp this point, since they appear to have the attention of Congress, yet they have repeatedly asked only for tax gimmicks, rather than sustainable solutions…
* – Just kidding… but I do think it’s a good style for this class of data!
** – It takes more than just a structure to make a house into a home, so I reject the term “New Home” sales. (You can buy & sell houses, but you have to <i>make</i> your home – yourself!)
What do you really own, in your 401k? Those shares of stock, those bonds – are they really the best way to invest in America’s future? Your future? The world’s?
If your 401k plan is like mine, you have some mutual fund choices – maybe even a lot of them. The mutual funds are either “passive” (index) stock funds, with a little of everything (within the index), or they are “active” (managed) stock funds… plus some bond funds. One example is the S&P500 index of most of the largest U.S. corporations.
Now, I save into the 401k because of how the game is rigged: I like to defer taxes until I actually need the money, and there’s the “free money” in the form of a “company match”. But I’m not happy with where I have to put my money in order to get those benefits. Do I really want to be financing the 500 largest corporations in the U.S.? Not all of them are exactly paragons of wise economic activity! Just look at what the fraud banking and health care sectors have been bribing lobbying Congress for… or the war-profiteers military-industrial complex… or the toxic junk & fast food vendors… or the telecommunications and power monopolies utilities… do I want to be investing in all THAT? Is investing supposed to be about profiting from the weaknesses of others, or about building up our collective strength? Even for otherwise reasonably productive large corporations, too often I hear about cutting quality in the name of profits, failing to actually serve their customers, and distributing rewards to management rather than shareholders.
That is not the system I want to be supporting and sustaining with my hard-earned savings. I cannot count on such a system to provide for my retirement, nor would I want to think that my last days of peace and relaxation were funded by such activities! So, I say no to the S&P500. And despite various fancy titles, unfortunately the other stock funds are pretty much the same witches’ brew.
No stock funds for me… So, what about bonds? This is long enough, so I leave that for the next post…
Update Feb. 18: similar chart as last week, but the new “Job Engine Oscillator” has been added… This ranges from 0 to 100%, with 100% being a strong economy – claims at a minimum (for a given week) within the data on the chart, and 0% being a terrible economy – claims at a maximum (for a given week)… This week’s data shows a drop in the Oscillator and a weakening of claims. Making matters worse, one wonders whether the claims last week may have been impacted by the East Coast blizzard.
The weekly unemployment claims data is looking a bit better than in early January, but it still sits midway between the “healthy economy” levels and last year’s “panic” levels. This doesn’t feel like a recovery. I will try getting the equivalent data from the 2000-2005 period for comparison..
Apropos of the current fears of another market panic in 2010, and a new topic for Do Not Feed the Squid fans: “How can we arrange economic matters differently, so that we do not have another crisis, either soon, or ever?”
There was an interesting discussion of the concept of “Automatic Stabilizers” to provide countercyclical fiscal policy, but like all other policy responses I don’t think auto-spending plans or other “stabilizers” will help to prevent future financial excesses. Centuries of financial history, as retold in books such as “Manias, Panics and Crashes” by Kindleberger, tell us that crash-preventing and crash-mitigating policy constraints tend to be undone by the same economic and political forces that lead to the financial excesses. It is not enough to imagine stabilizers, they must be implemented, and they must be implemented in such a way that they remain effective without being evaded or gamed.
Perhaps the best stabilizer is a system which doesn’t tend to excess in the first place, so that the resulting crashes are not so severe. The Founding Fathers, within the constraints of the 1700s, were not unwise in this regard – Article 1 of the U.S. Constitution actually has the simplest of all financial stabilizers, demanding that only gold and silver coin may be used as tender for debts (Section 10), authorizing only Congress to borrow money on the credit of the United States (Section 8), empowering only Congress to coin money (Section 8), and that “No money shall be drawn from the treasury, but in consequence of appropriations made by law” (Section 9). Congress has managed to mismanage this. Why should they be expected not to muck up any other “automatic stabilizers”? (An interesting side note — the rest of the Constitution does not even mention money.)
Now, the 1800s had plenty of financial ups and downs, and politicians (seeking always to take credit for trying to make things better?) have muddled with the system, so that despite the constitution gold and silver coin are no longer money, Congress has delegated a lot of financial responsibility, and savers seeking to invest must deal with a lot more “political risk”… Meanwhile, financial crises still occur, and they are certainly more complex now, but are they any less severe?
This sort of thinking led me to the following rant, which I want to post here for posterity:
We HAD automatic stabilizers! But the problem with “automatic stabilizers” is that, in a credit mania, the political process leads to the dismantling of the stabilizers. How many defensive mechanisms were put in place after the Great Depression, and then dismantled in the 1990s and early 2000s, again? We had banks that could be “failed out” via the FDIC. We had Glass-Steagall separating speculation from honest lending. We had lenders who had to own the risks of their own lending, not pawn them off via “securitization” (what an oxymoron! no one was made secure!). We had a whole alphabet soup of regulatory agencies.
We HAD automatic stabilizers. But we threw them away! The regulators allowed both commercial and investment banks to hide toxic debts “off balance sheet” (as though, in reality, there could even be such a thing?). We let the banks leverage up well beyond historically prudent levels, ignoring centuries of financial history and thinking “it’s different in our time” (I.D.I.O.T. thinking). These failures were systemic and widespread and they did not come out of nowhere for no reason. They occurred because a long reign of prosperity had led to complacent outlooks. They occurred because an overly complex system was built up to hide the sausage, and the new system permitted trillions of dollars in hidden fraud (Galbraith’s “Bezzle”). They occurred because the people asking for the bending of the rules were making gobs of money, and the people who had the authority to say no, in far too many cases, were too interested in sharing in those gobs of money and not sufficiently interested in protecting the public interest. They occurred because too many people were too enthralled with fancy new marketing terms, and the few who were sufficiently quantitative and skeptical to realize that a “credit default swap” is the same as an insurance contract (and thus out to be regulated as such) were outvoted.
We had automatic stabilizers, and when we actually needed them, they weren’t there anymore. And probably in 60-80 years the automatic stabilizers that we will put in place will also be thrown away, and in 70-100 years there will another enormous crisis. Unless we truly do something different this time. But the gridlock in Washington and the entrenched resistance on Wall Street doesn’t give one any reason for optimism.
Why is it, again, that everyone who created this mess is still in power? Why are the same regulators now expected to actually enforce prudent fiscal responsibility, whose nonfeasance enabled the runaway banks to drive us to the brink of ruin? Why is the same clique of bankers still in charge of the “too big to fail” institutions, that failed and were bailed? Why are the same Congresspeople in charge, who failed to exercise their proper oversight of the executive branch agencies and ensure that regulation actually took place? Why is it that the Federal Reserve is being allowed to purchase outright securities that are not “full faith and credit” obligations of the United States Government, despite the very clear language in the Federal Reserve Charter limiting the Fed’s authority only to those securities? Where are the protests at the TARP vote (against the will of the vast majority of those willing to contact their Congress)? Where are the riots against the indentured servitude our children and grandchildren will face, paying interest on $15,000,000,000,000 in debt that they did not ask for and which does them no good? (Those used to be “astronomic” numbers… now they are “economics” numbers!)
Oh… we haven’t DEMANDED either manual OR automatic stabilizers, yet.
The crisis will continue until the national response improves.